Account-Based Marketing Framework for B2B Outbound Teams
Build ideal customer profiles on behavioral signals, not just company size.

An ideal customer profile is not a demographic sketch. It is a hypothesis with testable conditions: which accounts carry the problem you solve, the budget to act on it, and the organizational conditions that allow a deal to close. Sketches describe characteristics; hypotheses predict behavior. The harder question is why so many ICP definitions look rigorous on paper yet still fail to predict which accounts actually close.
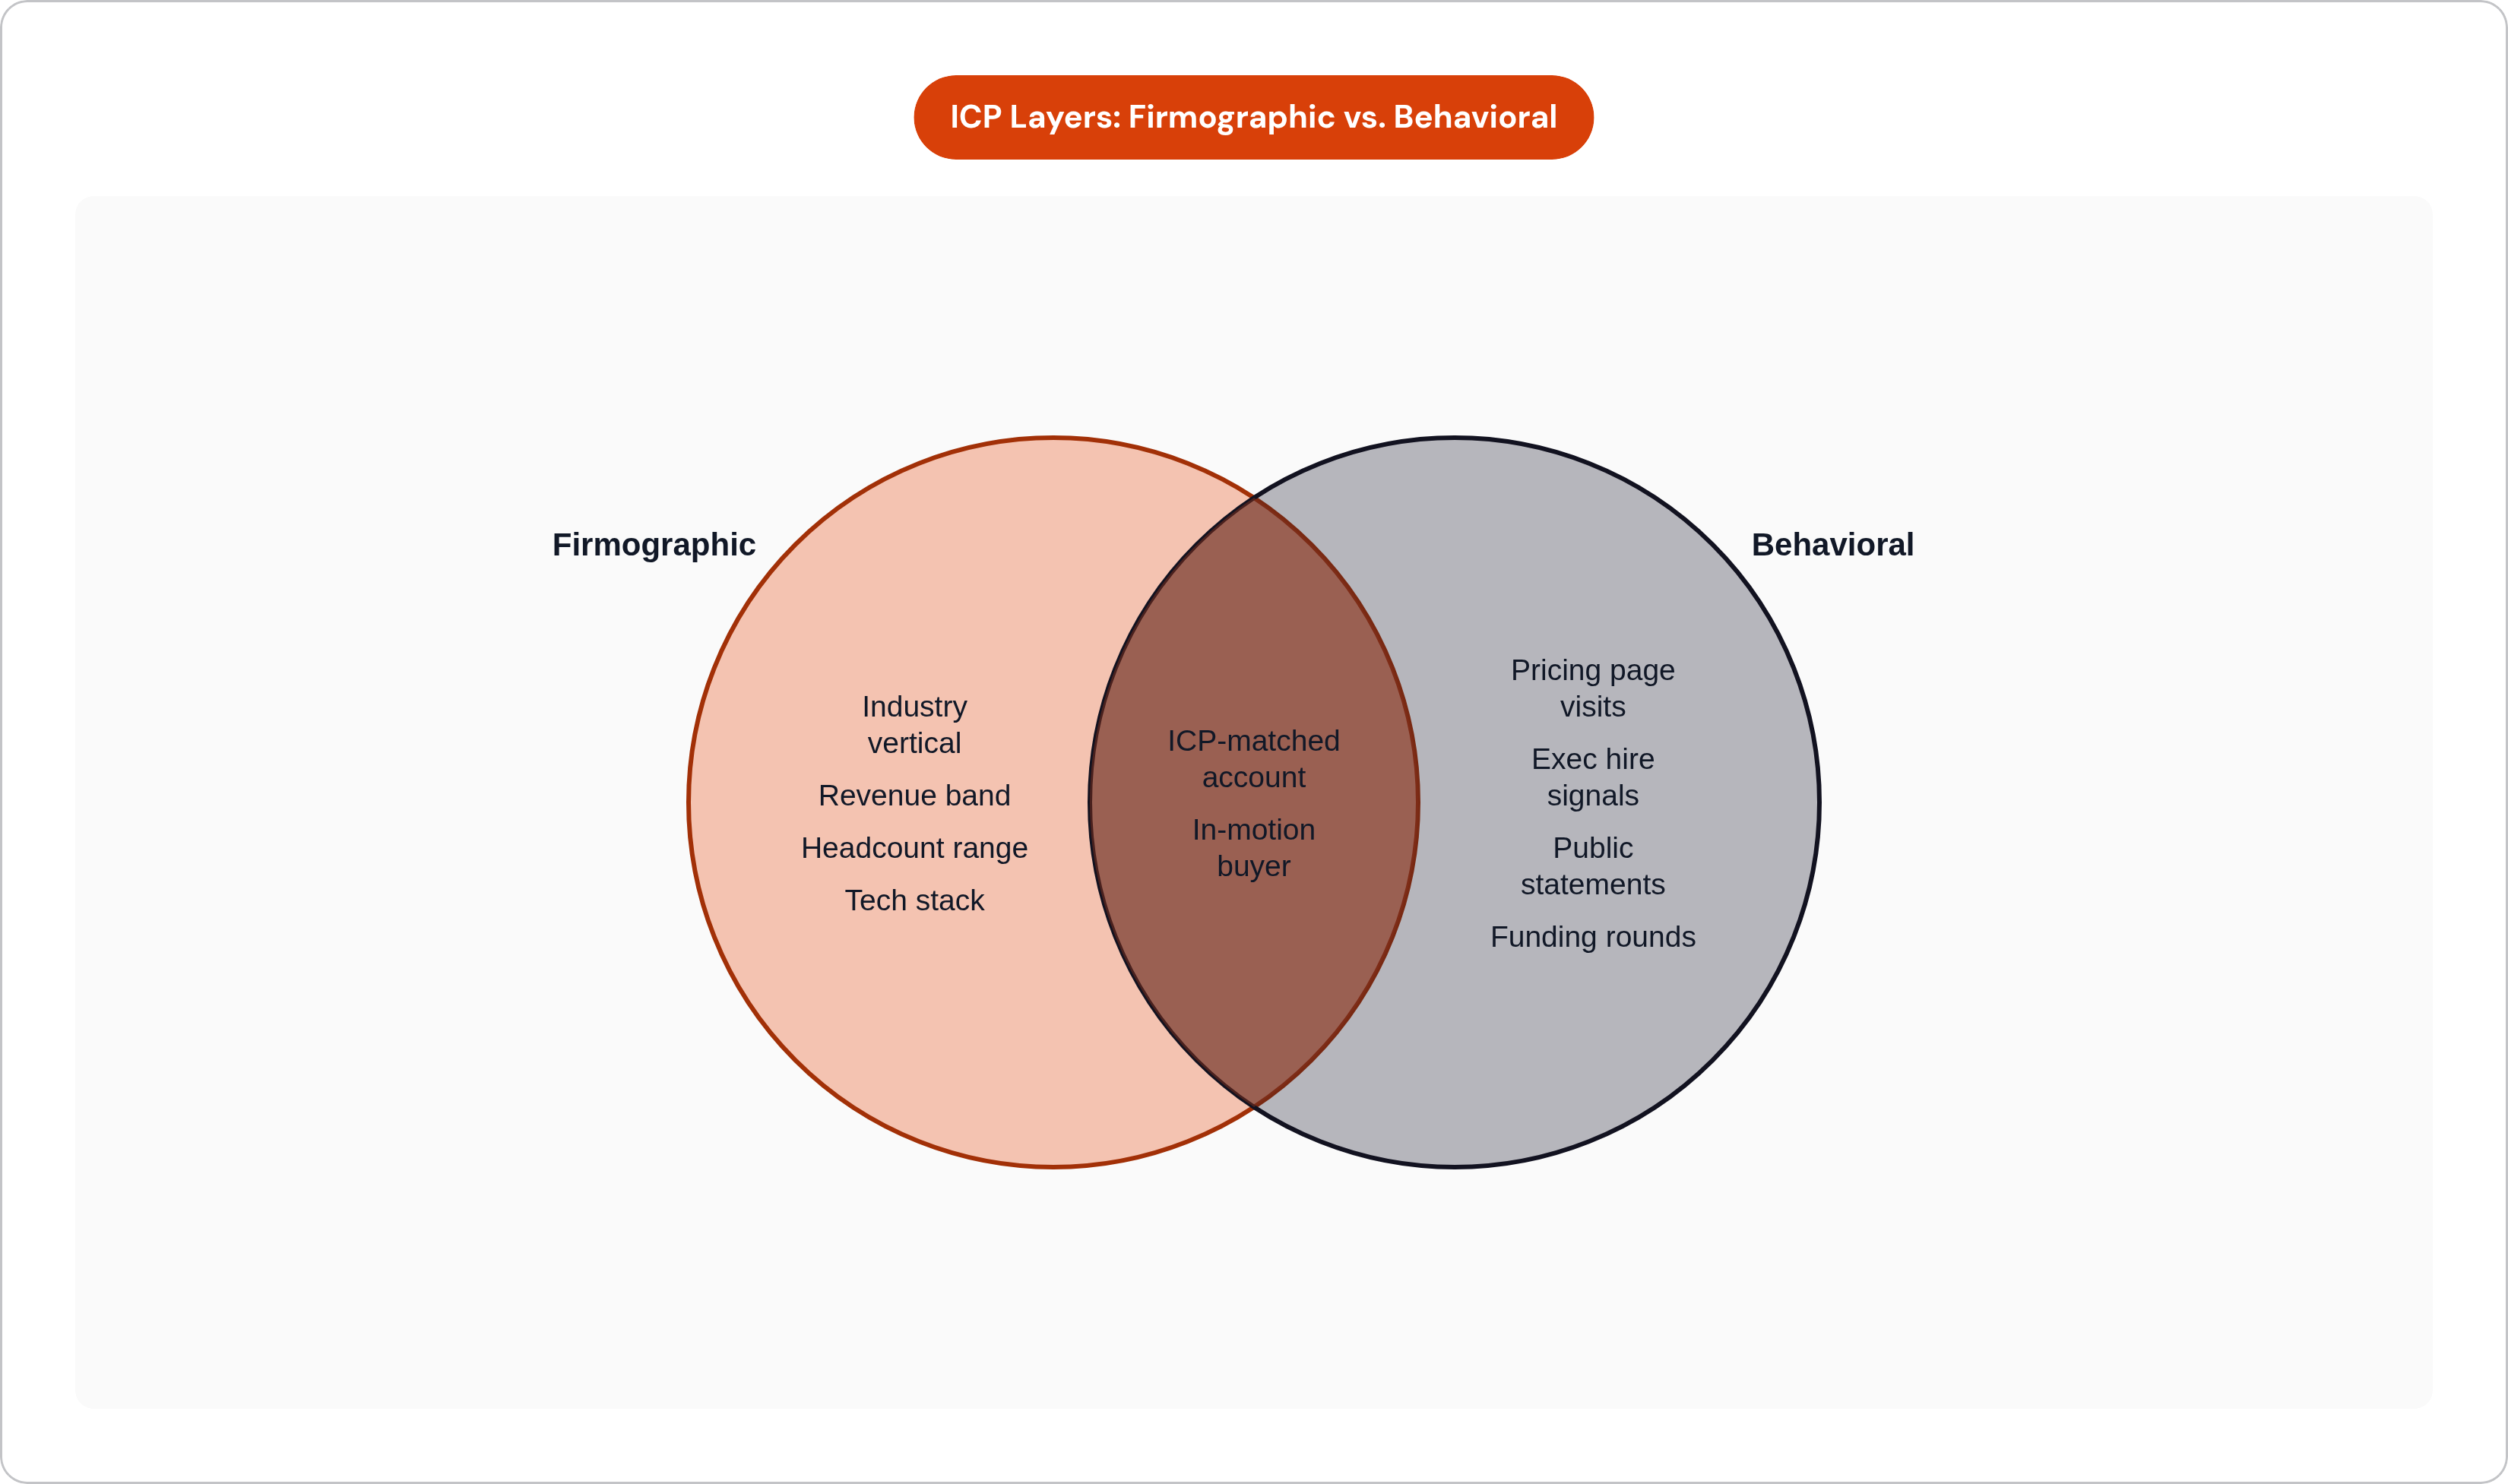
The ICP operates on two simultaneous layers, and most teams shortchange the second. The first is firmographic: industry vertical, revenue band, headcount range, geographic market, tech stack dependencies. These filters narrow the universe. The second is behavioral, which is where the real work lives: signals that a specific company is actively experiencing the problem your product addresses right now. A recent funding round. A new compliance or security hire. Repeated visits to your pricing page. A public executive statement announcing a strategic shift that creates the exact pain you solve. These are the intent signals that separate an in-market account from one that merely fits the profile.
A B2B SaaS team selling compliance workflow tooling might define their ICP as mid-market financial services companies, 50 to 500 employees, that have hired a security or compliance lead within the past 90 days. The firmographic filter narrows the universe; the behavioral filter identifies which companies within that universe are in motion. The distance between an ICP-matched account that is dormant and one actively building organizational capacity is not a nuance. It is the difference between a cold call and a timely one.
For founder-led teams, ICP clarity comes from evidence, not intuition. Run customer conversations with the explicit objective of listening for language rather than confirming assumptions, a discipline rooted in jobs-to-be-done research. The exact phrases prospects use to describe their problem are worth more than any internal positioning document. When prospects start repeating your framing back unprompted, the hypothesis is approaching confirmation.
Closed-won call transcripts remain the most underused ICP source in early-stage companies. They contain, in the buyer's own words, why that account decided to move, what alternatives they rejected, and what finally broke the tie. Most teams sit on that primary research without mining it. I have seen founders spend real money on third-party intent data while hundreds of hours of recorded buyer testimony collects dust in a folder nobody opens. The intent data tells you who might be interested. The transcripts tell you why someone like them actually bought.
The ICP definition is the input that makes every subsequent step in the account-based marketing (ABM) framework deterministic rather than arbitrary. Without a validated ideal customer profile (ICP), tiering is guesswork.
How to tier your target accounts so effort matches opportunity
Not every account that matches the ICP deserves the same level of investment. Tiering is the mechanism by which the framework allocates effort rationally, distributing resources in proportion to expected return. The harder question is what criteria actually determine which accounts belong where, and whether those criteria hold up under pressure.
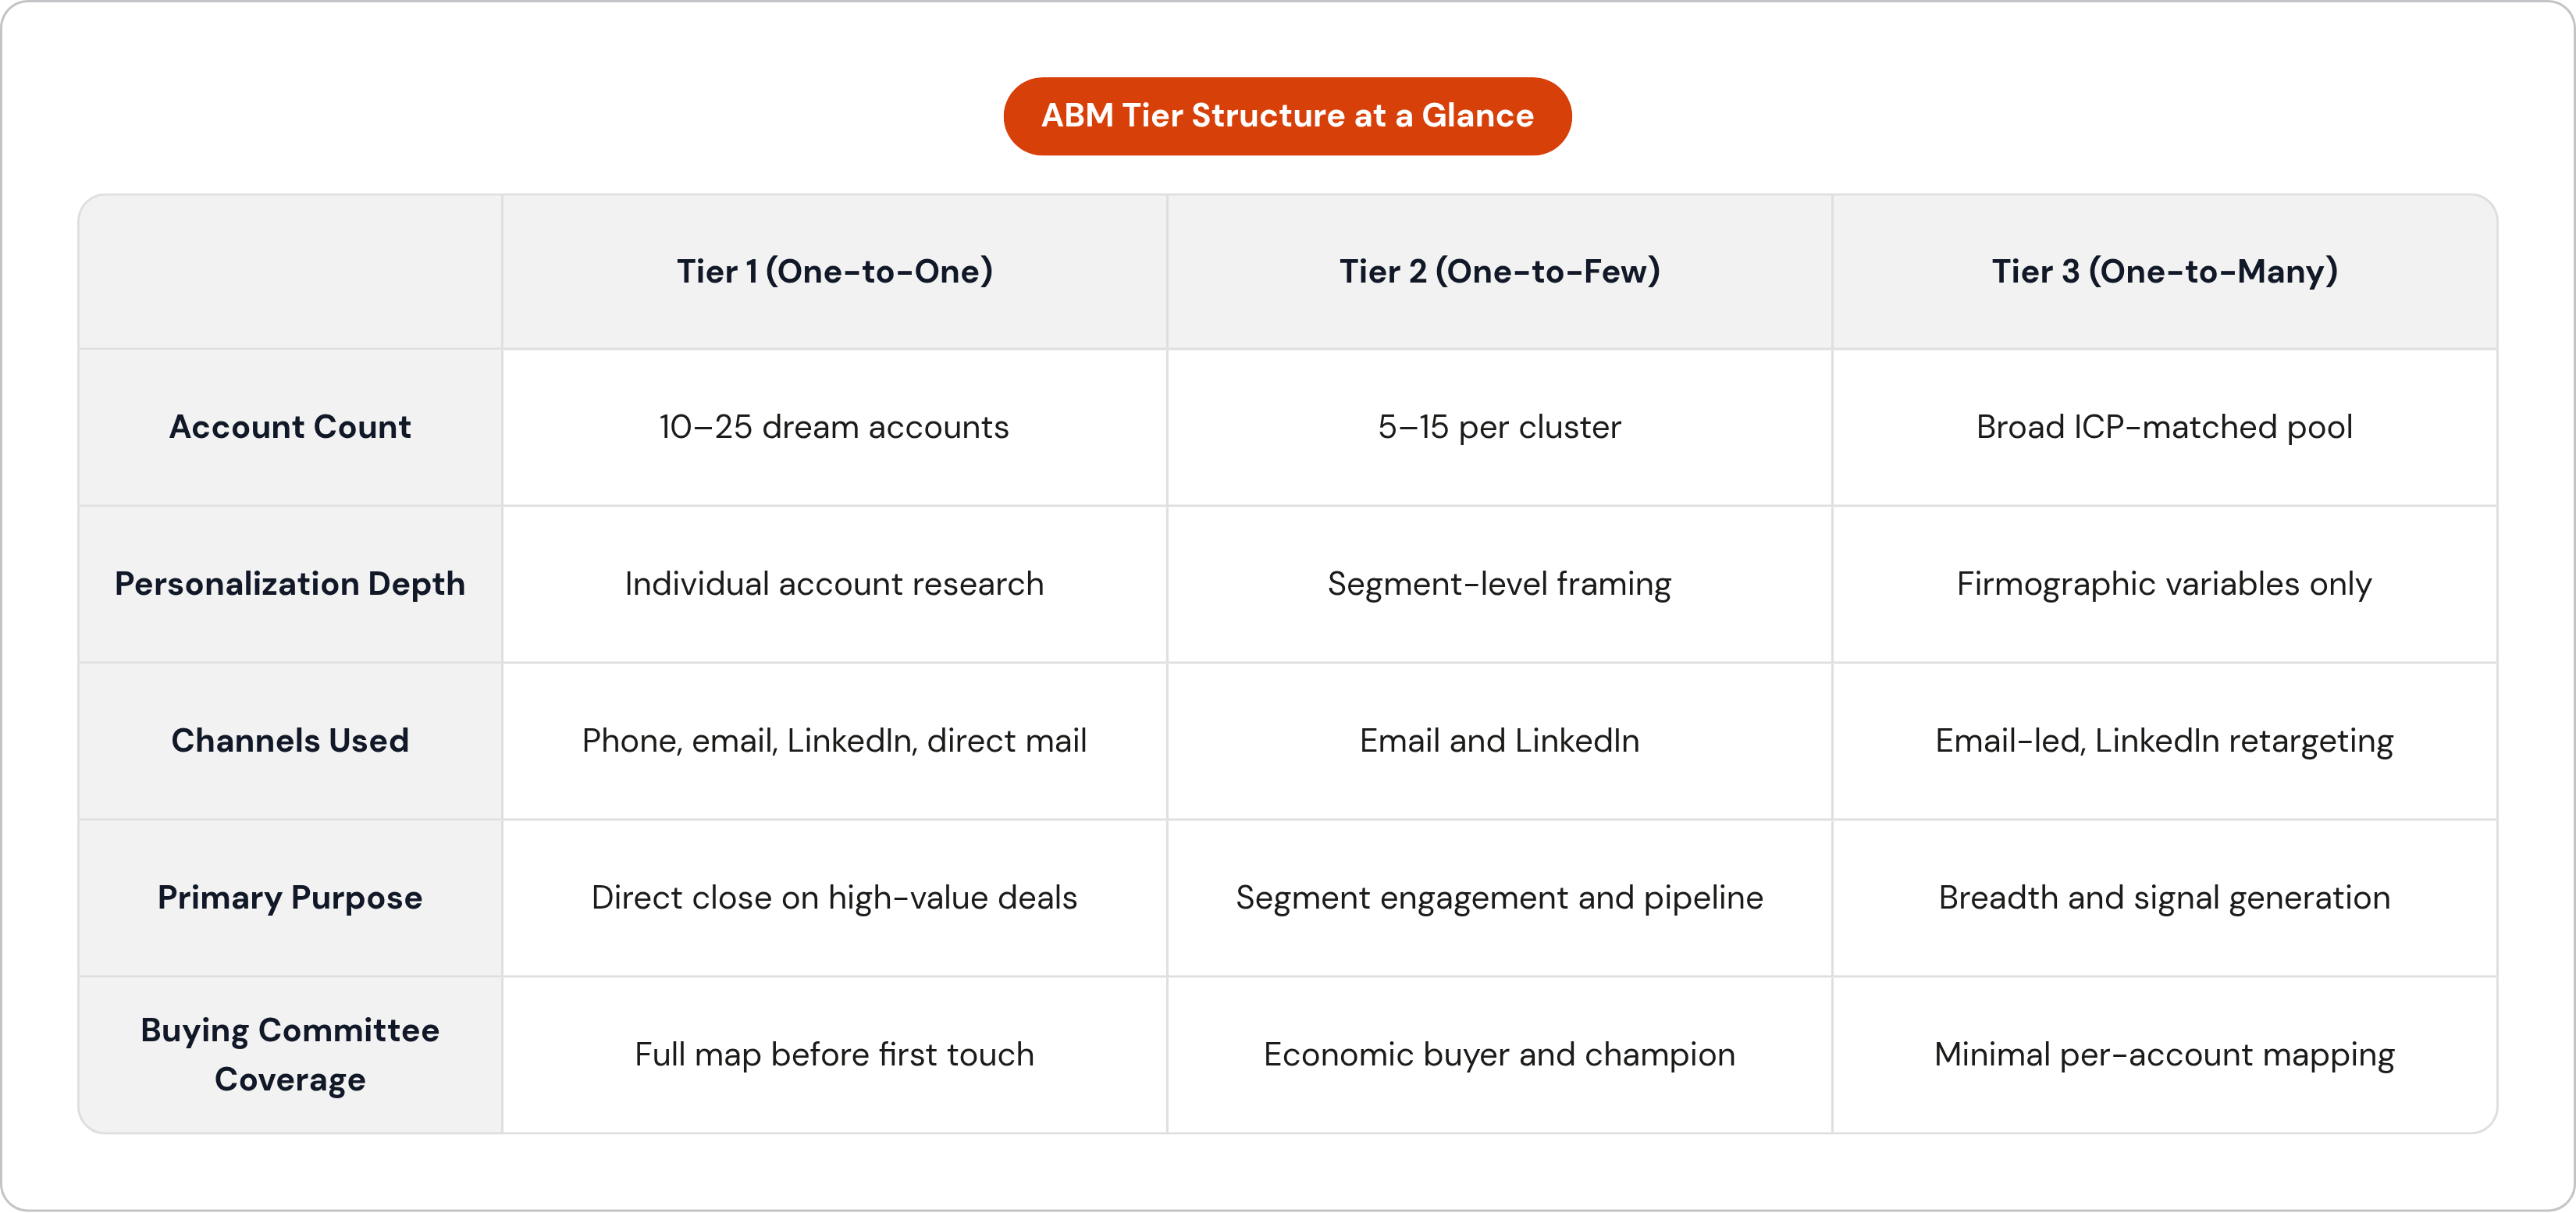
The standard structure operates on three levels. Tier 1, sometimes called one-to-one ABM, is reserved for the highest-value accounts: deep individual research, custom content, coordinated multi-channel outreach across multiple stakeholders, sustained over time, which practitioners call multithreading. Industry benchmarks place the marketing investment alone for this tier between $50,000 and $250,000 per account annually, a figure that concentrates minds on selection discipline. Tier 2, one-to-few, groups five to fifteen accounts sharing a meaningful characteristic, whether that is the same industry vertical, the same trigger event, or the same use case, with personalization operating at the segment level rather than the individual account. Tier 3, one-to-many, covers the broader ICP-matched population with programmatic personalization, lighter sequences, and minimal per-account investment. Its purpose is breadth and signal generation, not direct close.
For early-stage teams, the practical version is simpler: a short Tier 1 list of perhaps 10 to 25 dream accounts where the founder or a senior seller goes disproportionately deep, and a broader pool where outreach is templated but trigger-activated. The architecture is the same; the headcount and budget are smaller.
The criteria governing tier assignment deserve scrutiny. Potential deal size relative to current ACV. Strategic value beyond revenue, including logo recognition, expansion potential, or reference case utility. A fit score combining firmographic, technographic, and behavioral signal strength. The estimated accessibility of the buying committee. Accounts with high fit scores but impenetrable organizational structures often belong one tier lower than their revenue potential would suggest, and this is a judgment call that data alone cannot make for you. I have gotten this wrong. The score said Tier 1; the org structure said otherwise; I deferred to the score and watched the deal stall for six months before quietly dying.
Bev Burgess's 2025 framework introduces two specialized variants worth understanding. Scenario ABM describes a time-boxed intervention triggered by a discrete external event: a merger, a regulatory change, a technology transition. Pursuit Marketing addresses competitive displacement situations where the goal is to unseat an incumbent. Both behave like elevated Tier 1 plays with a defined endpoint, which matters because they require aggressive resource mobilization across a compressed window.
One principle that rarely gets stated plainly: tiering is not a one-time sort. Accounts surfacing strong new signals move up. Accounts that go dark after outreach move down. The tier assignment reflects current signal strength, not a permanent classification based on initial scoring.
Mapping the buying committee before the first touchpoint goes out
The defining structural fact of modern B2B purchasing is that decisions are committee decisions. Forrester's research on buying group dynamics documents that the typical B2B buying decision now involves 13 internal stakeholders alongside 9 external influencers. That is not a committee in the colloquial sense; it is an organizational process with multiple veto points, competing priorities, and internal political dynamics that no single outreach sequence can navigate by treating the account as a monolith.
The structural error most outbound sequences make follows directly from ignoring this reality. The default is to target one persona, usually the end user or the most accessible title, even though research suggests end users carry far less decision-making weight than practitioners tend to assume. The sequence is technically reaching the account while substantively missing the decision. A message that never reaches a veto-holder does not move the deal forward. It creates the appearance of activity while the actual decision unfolds elsewhere.
Committee mapping before first outreach requires identifying four categories of stakeholder. The economic buyer holds budget authority and may never appear on a demo call, but their signature closes or kills the deal. The champion is the internal advocate with a personal stake in the problem getting solved and the credibility to move colleagues. The technical evaluator assesses fit, integration risk, and implementation complexity. Blockers are the stakeholders whose objections, if unaddressed, derail deals that have otherwise reached consensus. Understanding the relationships between these roles, specifically who influences whom and whose opinion shifts the group, matters as much as identifying each individual.
Every stakeholder needs a message aligned to their specific concern. The CFO conversation is about risk reduction, payback period, and line-item defensibility. The VP of Engineering conversation is about implementation overhead, integration complexity, and technical debt. These are substantively different arguments about different stakes, not the same pitch in different wrapping. Forrester's research on buying group coverage finds that organizations aligning execution around buying groups rather than individual leads achieve win rates roughly two to three times higher, though the figure varies by segment and deal complexity.
For Tier 1 accounts, the committee map is completed before a single touchpoint is dispatched. For Tier 2 and Tier 3, a lighter version covering the economic buyer and the champion at minimum provides sufficient coverage without requiring the full research investment. Practical sources include LinkedIn organizational data, job postings that reveal reporting structures, enrichment tools that surface org signals, and closed-won call transcripts from similar accounts, which often reveal the actual decision architecture only after the fact, which is frustrating but still useful.
What signals to track before outreach, and how to act on them immediately
The timing problem ABM addresses is specific. When buyers are completing most of their research independently, the window during which outbound contact is welcome and relevant is narrow. Reaching an account before that window opens produces noise; reaching them after it closes produces friction. Signal infrastructure exists to identify when that window is open, and this is where most ABM programs actually fail — not in the ICP definitions or tier structures, but in their inability to move when a signal fires.
Signal categories divide into four types. First-party behavioral signals are generated by direct interaction with your own digital infrastructure: pricing page visits, product demo requests, content downloads, return visits within a defined recency window. These are the highest-quality signals because they require the account to initiate contact with your property. Third-party intent signals come from data providers aggregating keyword research activity across the web, indicating that an account is evaluating a product category before they ever arrive at your site. Trigger events are external developments that predictably create purchasing urgency: funding announcements that expand budget, executive hires in relevant roles, headcount growth that creates operational complexity, regulatory changes affecting the industry, M&A activity that disrupts incumbent vendor relationships. Competitive signals are subtler but often actionable: job postings describing requirements specific to a competitor's tooling suggest that incumbent may be under strain; public reviews surfacing dissatisfaction are an obvious entry point.
The action rule that separates operational ABM from passive monitoring is simple. A strong signal at a tiered account triggers outreach on the same business day, not the next scheduled sequence drip. Intent is perishable. The account actively researching your category on Tuesday may have reached a conclusion by Friday. I have watched deals evaporate because the signal sat in a shared dashboard nobody had ownership of. Forty-eight hours. The margin was literally two days.
Making this operational requires two conditions. First, signals need to route to a defined owner, a person, not a queue. Second, that owner needs pre-built messaging for each trigger type, so acting on a signal is a matter of personalization and dispatch rather than writing from scratch. For founder-led teams, this is the moment where tooling fragmentation becomes a real operational liability. Stacks where signals surface in one tool and outreach infrastructure lives in another introduce delays that destroy the timing advantage.
The emerging model for handling signal volume is the agent-qualified lead, or AQL. AI agents score and prioritize accounts using real-time intent and fit data, then surface the accounts whose signal combination warrants immediate human-crafted outreach. This replaces the static marketing-qualified lead model, which reflects a historical snapshot, with something that responds to live account behavior. The human still writes the message; the agent determines which account deserves it right now.
Building the outreach plays for each account tier
A play is a defined sequence of touchpoints, channels, messages, and timing built for a specific account type and trigger condition. The play matches the signal, the tier, and the stakeholder. It is not a generic sequence applied uniformly because the accounts all cleared the same ICP filter. What actually differentiates a play that generates a meeting from one that generates silence is usually not the channel or the cadence. It is whether the message demonstrates that someone did the work.
Tier 1 play construction begins before any outreach with a deep account research brief: recent news and public statements, apparent strategic priorities, confirmed tech stack, active hiring signals, executive commentary that reveals organizational thinking. The outreach itself is multi-channel and multi-stakeholder. A direct message to the champion. A separate, substantively different message to the economic buyer addressing their specific concerns. LinkedIn engagement with the technical evaluator that provides value before requesting anything. Custom content, a one-page use case framed around the account's specific situation rather than a generic case study, elevates the outreach from a pitch to a useful artifact. No template recycling at this tier.
Tier 2 play construction operates at the segment level. One message frame per cluster, such as accounts that recently raised a Series B in fintech, that personalizes at the shared characteristic rather than the individual account. Trigger-activated branching adds responsiveness: if an account visits the pricing page after the first touch, a different branch fires than if the account goes dark. AI-assisted research tools can handle multi-step account enrichment tasks across a cluster before a representative writes the first word, and this is where tooling creates real leverage without sacrificing signal fidelity.
Tier 3 plays use programmatic personalization anchored to firmographic variables: industry, role, company size. Sequences are shorter, investment per touchpoint is minimal, and the explicit purpose is breadth and surface-level engagement rather than direct close. Accounts that respond with meaningful engagement move up a tier. Tier 3 is a signal-generation mechanism, not a closing engine.
Research from Outreach has found that smaller, highly targeted campaigns meaningfully outperform broad blasts, and that stronger personalization lifts reply rates substantially. These are not marginal differences; they are the kind of performance gaps that change whether an outbound program is fundable. Exact figures vary by segment and methodology, and any single benchmark deserves scrutiny, but the directional finding is consistent enough to treat as reliable.
Channel allocation follows tier. Tier 1 earns the full suite: phone, email, LinkedIn, and direct mail where the account warrants the investment. Tier 2 runs primarily on email and LinkedIn. Tier 3 is email-led with LinkedIn retargeting as a supporting layer.
Running the 90-to-120-day ABM sprint before setting it on a quarterly cycle
The framework is designed as an initial sprint of 90 to 120 days, after which it transitions to a quarterly operating cadence. It is not a campaign with a campaign end date. The sprint establishes the infrastructure, validates the core hypotheses, and produces enough closed-loop data to run the framework intelligently going forward.
A suggested sprint phasing for a small outbound team. Days one through 30: lock the ICP definition, build and tier the initial account list beginning with no more than 25 to 50 total accounts, complete buying committee maps for all Tier 1 accounts, and establish signal tracking infrastructure. The temptation to begin outreach immediately is real and should be resisted. Plays launched before the infrastructure is set produce data that cannot be interpreted.
Days 31 through 60: launch Tier 1 plays against the first cohort, run Tier 2 and Tier 3 simultaneously at proportionately lighter investment, and document every response and objection in real time. The documentation is not optional. It is the raw material for everything that happens in the third phase.
Days 61 through 90: assess what is generating meetings and pipeline. Cut plays that produce no response after sufficient exposure. Sharpen messaging on the plays showing traction. Move accounts between tiers based on current signal strength. Add conversion infrastructure for accounts that have entered active conversation: a tighter demo flow, prepared objection responses, references sourced from similar closed-won accounts.
Avoid adding channels before you have message clarity, and do not expand the account list before the plays are working. ABM that scales prematurely amplifies noise rather than pipeline. The discipline of the sprint is staying small long enough to learn something, which runs against every instinct a growth-stage team has. I have seen founders blow past this phase in the first two weeks, convinced they already knew what worked, and then spend months chasing an account list that was never validated. The regret is consistent and expensive.
After the sprint, quarterly review cycles re-tier accounts based on updated signal activity, refresh the ICP based on closed-won data from the previous quarter, and retire plays that have decayed. For founder-led teams, the sprint also serves as market intelligence. An account that matches every ICP criterion but produces no engagement across a full play sequence is worth interrogating rather than ignoring. Sometimes it tells you the ICP is wrong. That finding alone can justify the sprint.
The metrics that tell you whether the framework is working
ABM measurement requires a different unit of analysis than traditional funnel metrics. The account is the unit, not the lead. Conversion rates, cycle length, and engagement are tracked at the account level; individual lead activity within a target account is a contributing data point, not the metric itself. This sounds obvious until you try to run it inside a CRM configured for MQL-based reporting, which most of them are.
Mature ABM programs convert at meaningfully higher marketing-qualified account (MQA) rates than less mature programs, and the gap is not explained by account selection alone. It is produced by the compounding effect of tighter ICP definition, more disciplined play execution, and measurement systems that route learning back into the framework. Specific percentages from published benchmarks vary considerably by source, segment, and how programs define qualification; citing a single figure here would produce false precision rather than useful guidance.
Account penetration measures what percentage of the mapped buying committee has been reached at each Tier 1 account. Account engagement rate tracks whether targeted accounts are increasing their engagement with content, email, or site properties after outreach begins; a flat or declining curve is an early indicator that the play needs revision, not that the account needs more volume. Pipeline velocity measures how fast accounts move from first touch to qualified conversation to proposal. Win rate by tier is the metric that justifies the investment structure: Tier 1 programs built correctly should show meaningfully higher win rates on large deals than non-ABM cohorts, though the magnitude depends heavily on execution quality and deal complexity. Sales cycle compression at the Tier 1 level is the second financial justification for bespoke investment in high-value accounts, because time-to-close has a direct effect on capital efficiency that is straightforward to model for board purposes.
Knowing what to avoid measuring matters as much as knowing what to track. Individual lead volume, raw email open rates, and MQL counts actively mislead ABM programs by rewarding activity over account progress. These metrics optimize for the wrong behavior: more sends, more opens, more form fills, none of which are predictive of account-level pipeline in an ABM motion. I have seen teams celebrate record open rates during quarters where they generated no qualified pipeline. The metrics told a story; it just was not the right one.
The iteration loop closes here. Every closed-won and closed-lost at a named account is a structured data point. Call transcripts reveal which objections appeared and when. Stakeholder response patterns across the buying committee show which personas engaged and which were unreachable. Play timing data shows whether outreach preceded or missed the buying window. All of it feeds back into play design for the next quarter, which is why the framework compounds over time rather than plateauing. For founders reporting to investors, the metrics that tell a fundable GTM story are pipeline velocity, conversion rates by account segment, and CAC payback period. Raw outreach volume does not tell that story, and optimizing for it while running an ABM program is a category error.