Measuring Outbound Quality Beyond Open and Click Rates
Open and click rates mask whether outbound actually moves deals forward.

Open and click rates were built for newsletters and product launches, not for cold outbound with a dollar figure attached to it. This piece swaps those two metrics for a set that actually tells you whether outbound makes money: reply quality, meeting conversion, pipeline contribution, and how fast you respond to intent signals. Open and click rates answer "did we send a lot." The question that pays the bills is "did it move a deal forward." Those aren't the same question, and treating them like they are is how a team ends up running its pipeline on fiction.
A meaningful share of outbound marketers say their campaigns feel like they're not working, even while open and click numbers look fine on the dashboard. That gap isn't a coincidence. It's a sign the metrics were never measuring the thing anyone actually cares about. Click rate tells you a subject line worked. It says nothing about whether the person who clicked has budget, has authority, or has a live problem your product solves. Teams that chase opens and clicks are chasing activity, because activity is safe: it almost always goes up, and up feels like progress even when the pipeline hasn't moved an inch.
How Apple MPP turned open rate from a weak signal into an actively misleading one
Open rate was already thin. Apple Mail Privacy Protection made the problem worse.
Here's the mechanism: Apple loads the tracking pixel before a human ever sees the email, so Apple's own servers fire the "open" event whether the recipient reads the message, skims it, or deletes it without a glance. That inflates reported open rates by somewhere around 15 to 20 percentage points, and as of early 2025, MPP accounted for close to half of all tracked opens industry-wide. Half of what your dashboard calls "engagement" is a privacy feature firing on autopilot rather than a person deciding your email deserved a second look.
The fallout is blunt. If your dashboard reads 40% open rate, the real number might sit closer to 20 or 25%, and there's no clean way to correct for it because MPP adoption swings by list and by device mix. You can't apply one discount factor and trust it across campaigns. The pixel generating this fictional number also works against you directly: it's a known deliverability drag on sender reputation, and pulling it out tends to help inbox placement rather than hurt it. So the open rate costs you inbox real estate and email deliverability headroom to manufacture a number that was already wrong for most senders before Apple ever got involved.
That's a strange trade to keep making, and yet plenty of teams still open their Monday pipeline review with it. Doing that means starting the conversation with the least trustworthy number in the whole dataset.
Reply rate as the new diagnostic starting point — and why you need two versions of it
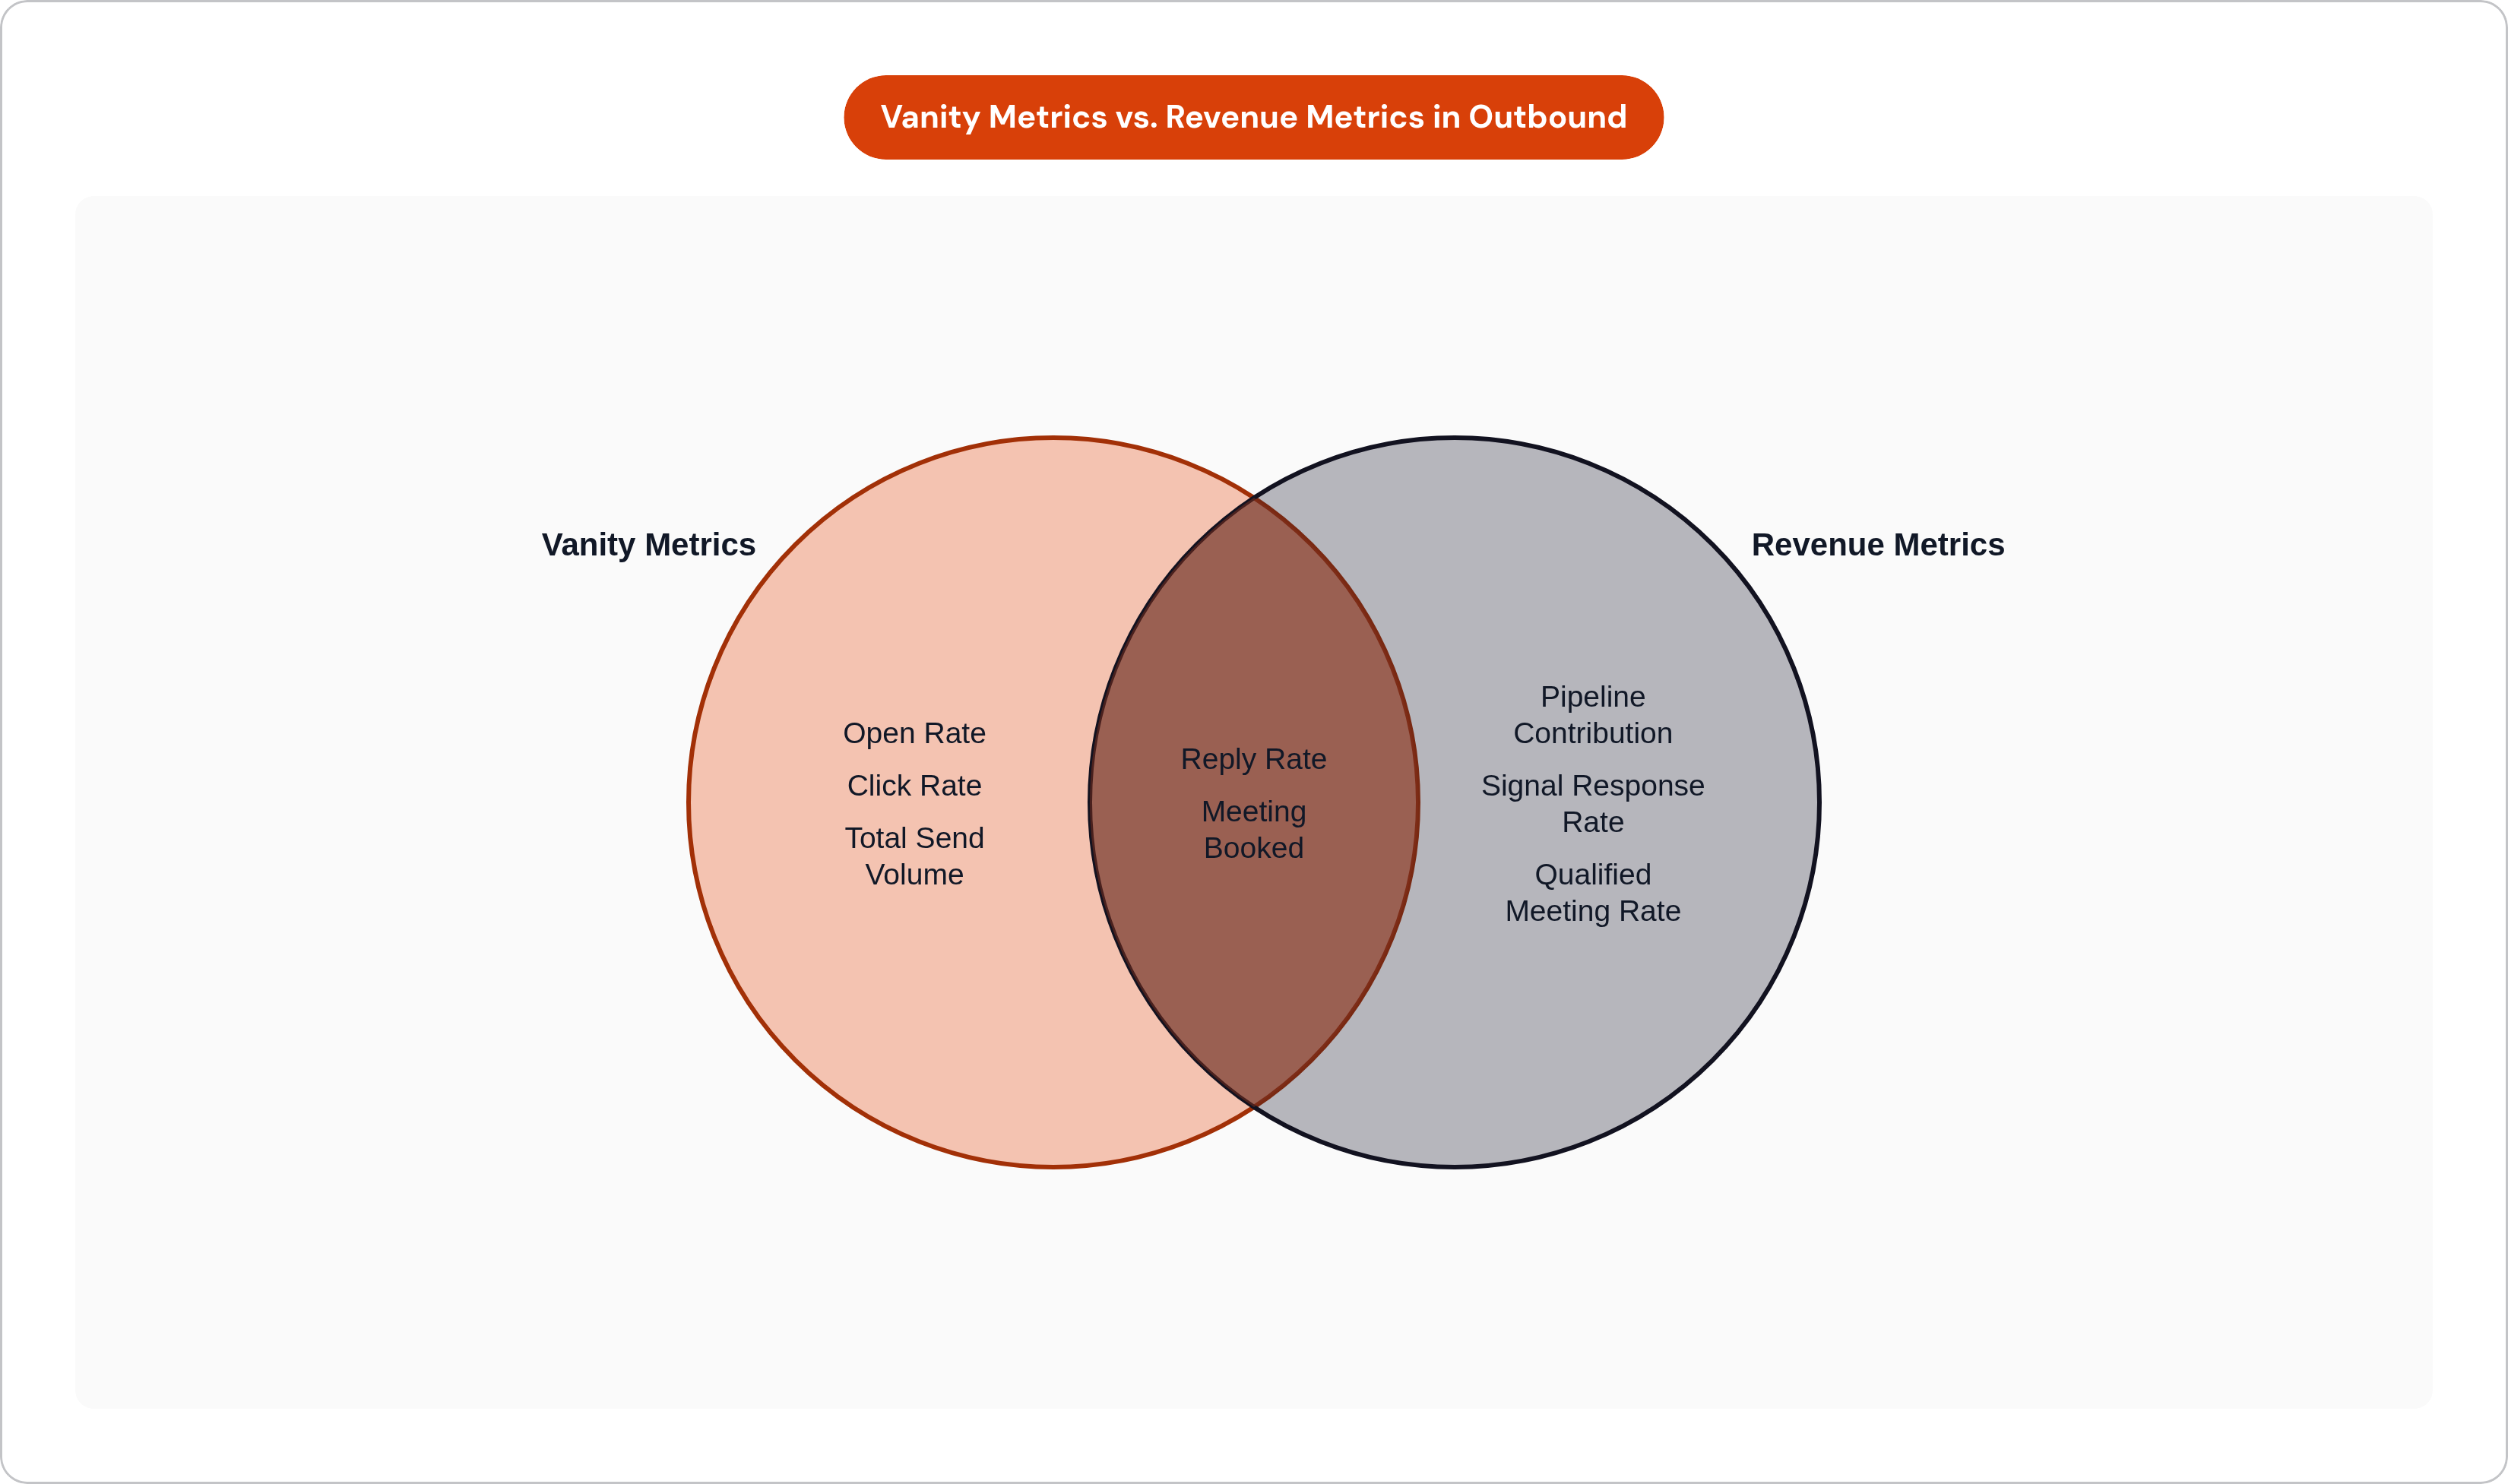
A pixel can't fake a reply. Somebody has to read the message, form a judgment, and decide it's worth typing something back, which makes reply rate the first metric here that reflects actual human behavior instead of client-side automation.
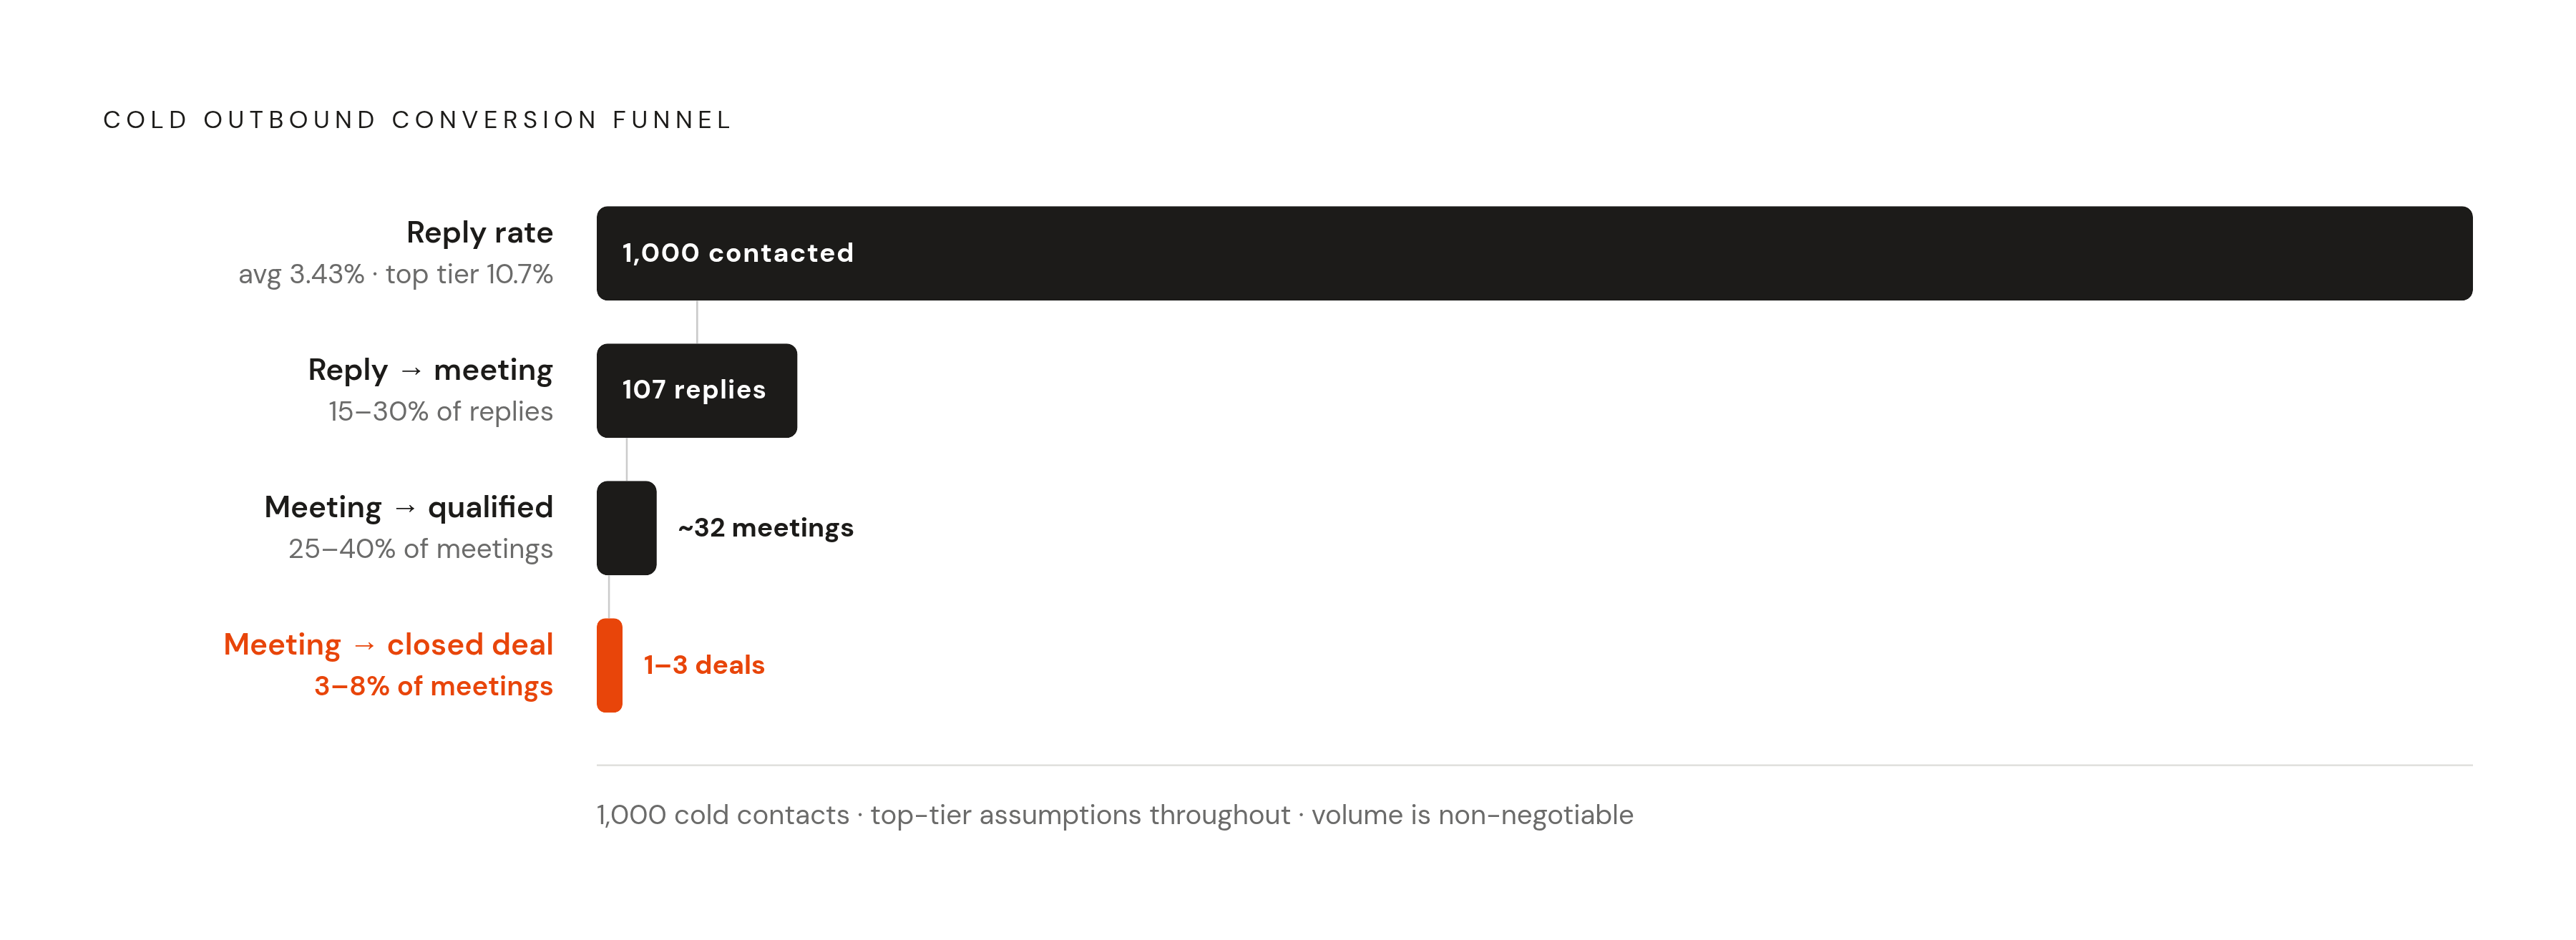
Instantly's 2026 Cold Email Benchmark Report, built from billions of interactions across thousands of workspaces over 2025, puts the platform-wide average reply rate at 3.43%. Top-quartile senders hit 5.5% or better; the top tier clears 10.7%. That average has been sliding, down from roughly 5.1% in 2024 and around 7% in 2023. Inboxes are getting more crowded, filters are getting sharper, and generic outreach gets caught faster than it used to. That's not cause for panic, but it is a reason to stop grading yourself against last year's curve.
Context matters more here than almost anywhere else in this piece. Legal Services sits around 10% reply rate, the highest tracked vertical. Healthcare and MedTech run 4 to 6%. Manufacturing sits at 4 to 5%. Financial Services comes in around 3.4%. SaaS sits at the bottom, 1.9 to 3.5%, probably because software buyers' inboxes are already the most saturated real estate in B2B. Run SaaS outbound and benchmark yourself against the Legal Services number, and you're chasing a target that was never built for your buyer.
Now the part that gets skipped constantly: total reply rate and positive reply rate measure different things, and tracking only the first one is a trap. Total reply rate tells you the message landed. Full stop. It says nothing about sentiment. Positive reply rate, ideally 15 to 50% of total replies, tells you whether it landed with someone actually interested versus someone typing "remove me from this list." A 10% total reply rate stuffed with unsubscribes will book fewer meetings than a 5% reply rate where most of the responses are curious. What share of your replies right now are positive? If you don't know off the top of your head, that's the first gap to close before you touch anything else in this framework. One more floor while you're in there: hard bounce rate should sit under 2%. Above that, you don't have a copy problem, you have a list problem, and no amount of clever subject lines fixes a bad list.
Meeting conversion rate and what it reveals about ICP fit upstream
Reply rate tells you what's wrong. Meeting rate tells you where to look next, and it's usually the first number sales leadership actually checks, since a booked meeting is the first thing outbound produces that a sales leader can hold in their hand.
A full calendar isn't automatically a win, though. Filling slots with curiosity calls that never qualify is a vanity metric in a nicer outfit. Martal Group's 2025 B2B sales KPI benchmarks put high-performing teams at a sequence-to-meeting conversion rate of 1.5 to 4%, with the spread driven mostly by deal size and buyer seniority. Enterprise sequences aimed at the C-suite land at 1 to 2% sequence-to-meeting; mid-market sequences aimed at directors and VPs run higher, 3 to 5%. That spread tells you something on its own: going after bigger logos means accepting a lower conversion rate as the price of admission, not a sign something's broken.
Qualified meeting rate is where this number actually earns its keep. A solid benchmark is 60 to 70% of booked calls qualifying once someone's actually on the phone. Fall below that, and something upstream is broken: the ideal customer profile (ICP) is too broad, the value proposition isn't sharp enough to filter out the wrong buyers before they book, or the call-to-action in the sequence is promising something the meeting doesn't deliver. This is the point where outbound quality becomes visible to the rest of the go-to-market team. It's the handoff, and a sloppy handoff here poisons everything downstream no matter how clean the reply rate looked two steps earlier.
Pipeline contribution as the metric that closes the loop between outbound activity and revenue
Most teams stop measuring the second a meeting gets booked. That's exactly where the tracking falls apart, and it's exactly where the real question, does this outbound program produce revenue, goes unanswered.
Lead-to-opportunity conversion is the bridge here: aim for 20 to 35% of meetings turning into qualified opportunities, per standard industry benchmarks. Oppora's 2026 cold email data adds resolution to the rest of the funnel: reply-to-meeting conversion runs 15 to 30%, meeting-to-qualified-opportunity runs 25 to 40%, and meeting-to-closed-deal sits at a sobering 3 to 8%. That last number deserves a moment. It's the clearest argument in this whole piece for why pipeline volume matters as much as pipeline quality; even a well-qualified opportunity closes at single digits more often than not.
Pipeline coverage ratio, total pipeline value divided by revenue target, gives leadership a decent health check on win rate health on top of all this. The common standard is 3 to 4x coverage, but the right number depends entirely on win rate, which is exactly why you can't skip the rest of the funnel to get here. A team closing at 25% needs 4x coverage to hit quota. A team closing at 33% only needs 3x. Quote either ratio without knowing your actual win rate, and you're citing a number that means nothing. For founders and GTM leaders, the frame that matters is pipeline contribution broken out per sequence, per rep, and per campaign, because that's the only version of this metric, sometimes called sales velocity at the program level, that actually answers whether outbound is paying for itself.
Intent-signal response rate — the metric that high-velocity outbound programs track that most don't
Signal-based outbound runs on a different clock. Cold sequencing can tolerate some delay; signal-triggered outbound, built around buying intent signals like pricing page visits, funding announcements, job changes, hiring surges, can't. Timing does most of the work here, arguably more than message quality.
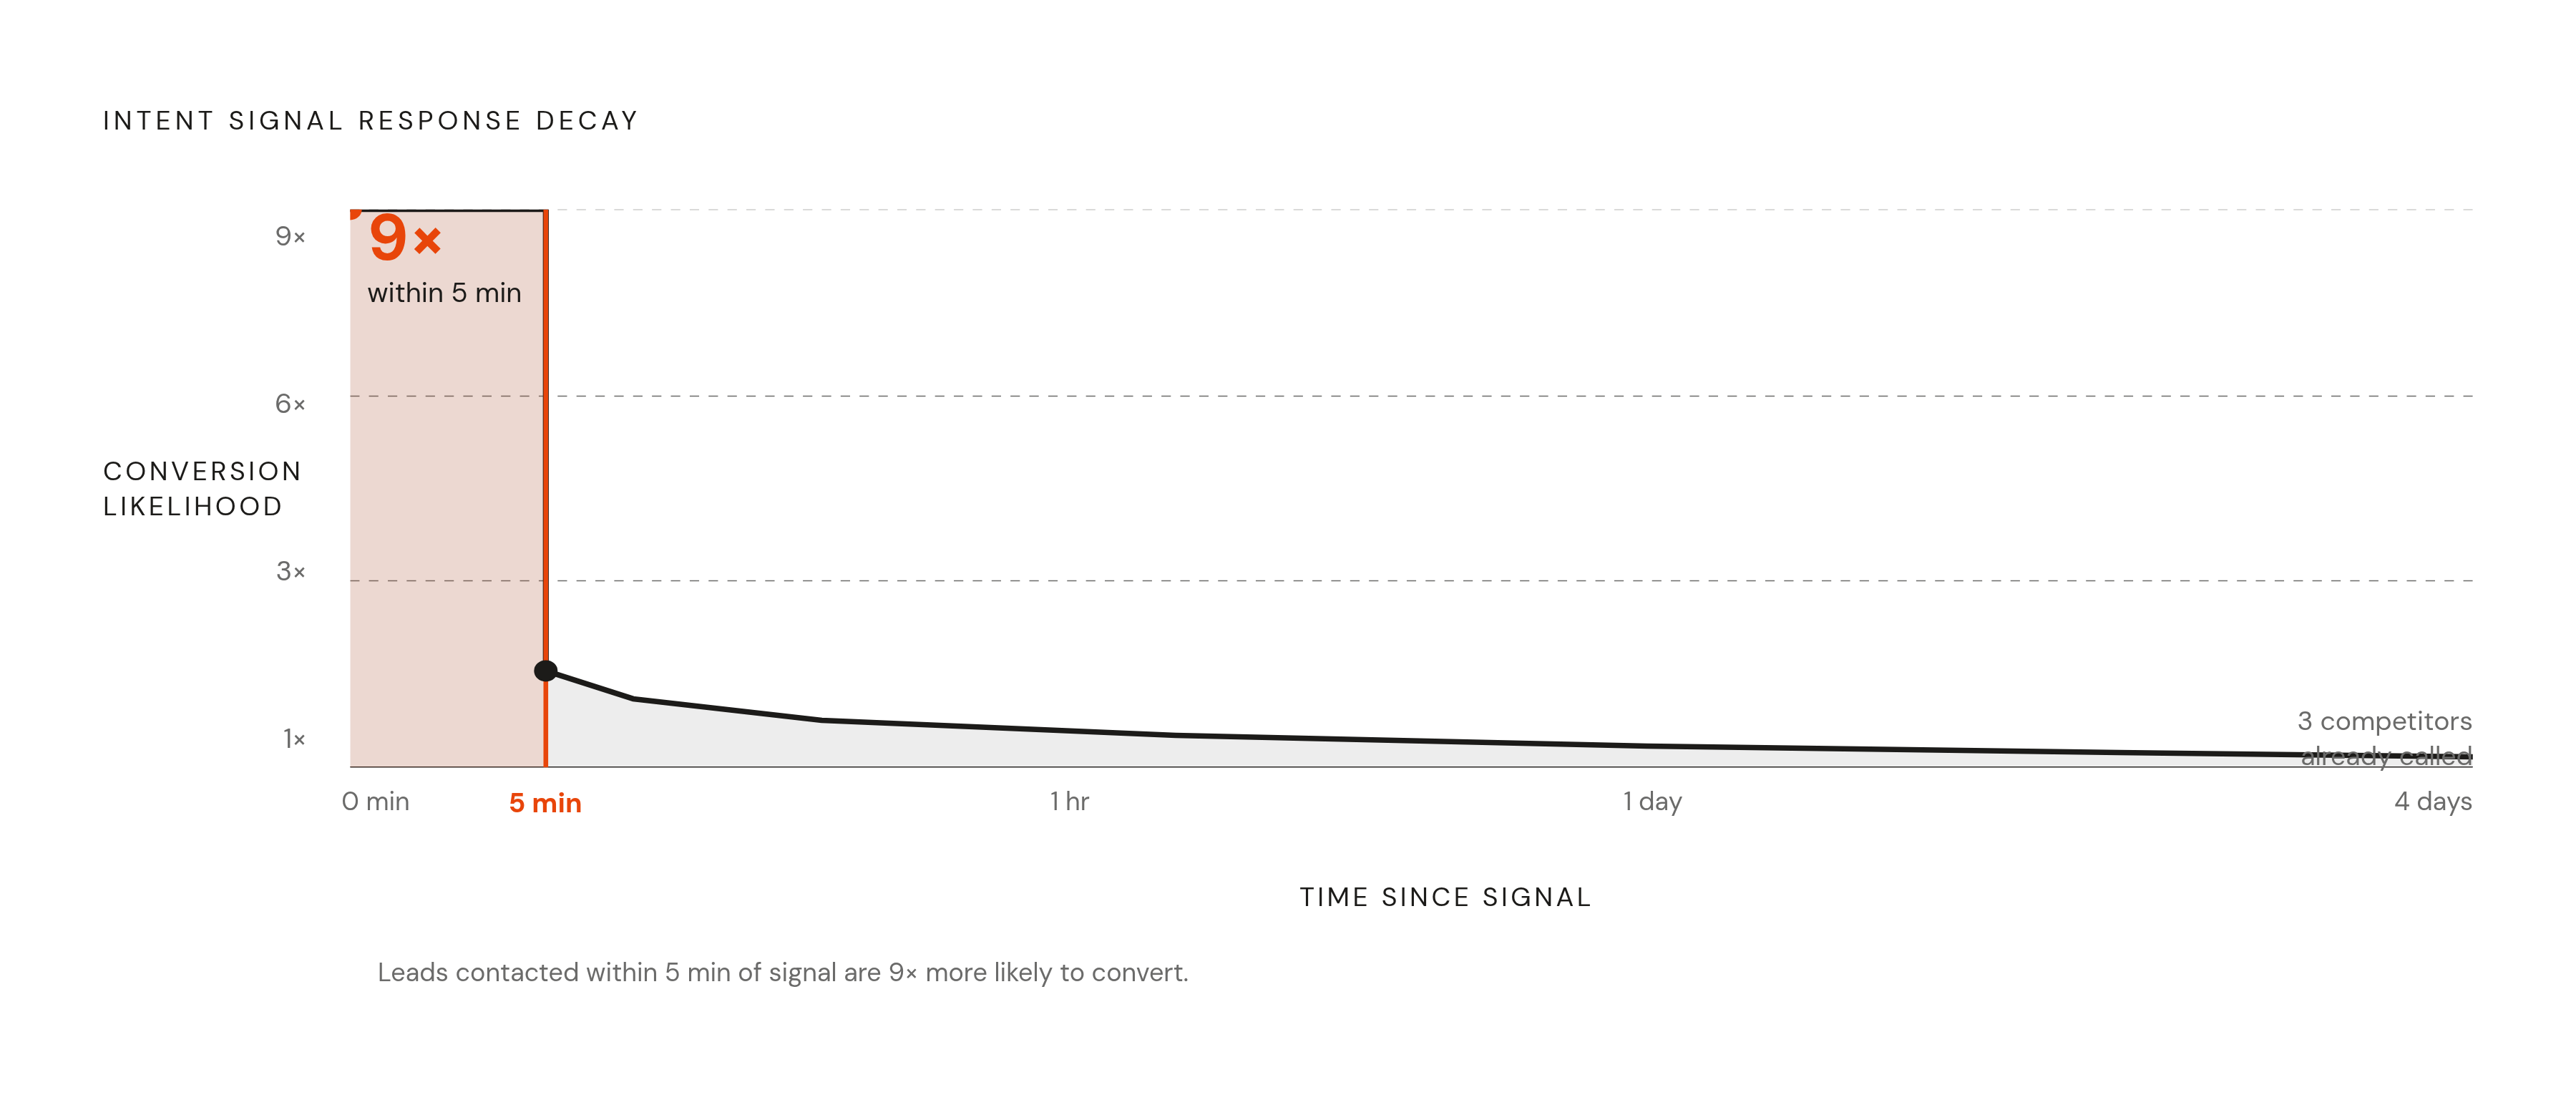
The decay curve is steep. Leads contacted within 5 minutes of a signal firing are roughly 9x more likely to convert than leads contacted later. That's not a small gap. It's the difference between a motion that works and one that quietly doesn't. Signal-to-action cycle time is the operational number worth watching closely here, and it should be measured in hours, not days. A funding announcement that takes four days to act on has already been worked by three competitors before your rep even sees the alert. Hold yourself to same-day response on high-intent signals, sub-hour on the highest-value ones.
The metrics that matter for this motion specifically are signal-to-reply rate, signal-to-opportunity conversion, and pipeline generated per signal type, tracked separately by trigger. Not every signal converts at the same rate, and tracking by type is the only way to learn which triggers actually produce pipeline versus which ones are just noise wearing intent's clothing. Analytic Partners is a useful data point here: after consolidating research and signal monitoring into one workflow, the team grew qualified pipeline 40% year over year while cutting per-account research time from three hours down to fifteen minutes. That's a structural gain, and it compounds, because the time a rep gets back goes into selling instead of digging through fifteen browser tabs.
Which raises the obvious question: how much of a rep's day is actually spent selling right now? Industry figures put it around 30%. Consolidating signals into one place is one of the highest-leverage ways to claw back the other 70%, and the reason is almost mechanical. Fragmented stacks, where signals live in one tool, sequences in another, and the CRM sits in a third, create exactly the lag that kills a signal-based motion. A connected setup closes that gap, while a disconnected one guarantees you're always a step behind whoever isn't running one.
How AI agents change what's measurable and what's executable in outbound
Worth being precise here, because "AI agent" gets used loosely enough to cover two genuinely different things: sensing agents and acting agents.
A sensing agent flags that a prospect went cold, or that a signal fired, and stops there. It adds a line item to a dashboard someone still has to check. An acting agent goes further: it sends the follow-up, logs the activity, updates the CRM, and moves the opportunity forward without waiting for a rep to notice the flag in the first place. That distinction sounds small on paper. In practice, it's the difference between a tool that adds visibility and one that actually closes the gap between signal and action from the last section.
Where does this touch the metrics built up through this piece? Reply quality improves when an agent personalizes off the actual signal instead of dropping a generic sequence on everyone regardless of context. Signal-to-action cycle time compresses because the agent fires the touch immediately instead of sitting in a rep's queue behind eleven other tasks. Pipeline contribution tracking gets cleaner too, since agents log every touch and outcome straight into the CRM, closing the manual-entry gaps that quietly corrupt attribution in most systems today.
None of this comes free of a governance question, and it's worth naming rather than skating past. Fully autonomous agents carry real brand-voice and compliance risk once they're running at scale, so small test cohorts and a message-quality review step before wide rollout protect the exact metrics this whole framework is built around. A connected setup where AI agents handle distinct plays (outbound, follow-up, scheduling, CRM sync) inside a single system avoids the fragmented, multi-tool stack that introduces the lag and data loss corrupting quality metrics in the first place. The agents run alongside the measurement framework above, which is what makes it possible to act on what that framework reveals fast enough for the timing to actually matter.
Building the measurement cadence — how to audit what you track now and replace it
Start with an audit, and be honest about what turns up. If open rate is still the first number mentioned in a weekly outbound review, the review is running on the wrong inputs, full stop, and everything downstream of that meeting inherits the distortion.
The replacement dashboard, in rough priority order: total reply rate and positive reply rate, tracked per sequence and per sender so you can see where quality is actually coming from. Then qualified meeting rate, the share of booked calls that genuinely belong in pipeline. Then lead-to-opportunity conversion, tracked forward from the meeting booked, not backward from the original send. Then pipeline contribution, broken out by campaign so you know which sequences are paying for themselves and which are just busywork. And for any signal-triggered motion, signal-to-action cycle time, measured in hours.
Treat the benchmarks in this piece as floor checks, not targets to chase blindly. The 3.43% average reply rate is a sanity check, not a goal; top performers clear 10.7%, and where you land depends heavily on your vertical. A SaaS team should expect a lower reply rate than a Legal Services team, and grading yourself against the wrong comparison group will make good work look like failure. Hard bounce rate under 2% is a prerequisite, not something to optimize toward; fix the list first, everything else second.
The teams that improve fastest aren't the ones tracking the most numbers. They're the ones using what they track to decide what to cut and what to double down on, cycle after cycle, which is really the whole point of building something like this: a number that never drives a decision isn't a metric, it's decoration on a dashboard nobody needed. For founders running outbound solo in the early days, reply rate and positive reply rate are enough to start with. Add meeting and pipeline tracking once there's enough volume to see a real pattern in the data, and not a day before.