How B2B SaaS Outbound Benchmarks Differ by Deal Size
Win rates and reply rates shift sharply by deal size, not average.

How B2B SaaS Outbound Benchmarks Differ by Deal Size. This piece translates the benchmark landscape into a practical, tier-by-tier reference that tells GTM teams what 'good' looks like for their specific deal size.
Why outbound benchmarks mean different things at different deal sizes
Outbound benchmarks like reply rate, win rate, sales cycle length, CAC payback, and pipeline mix shift by wide margins depending on deal size, and a team that grades itself against the wrong tier will draw the wrong conclusion about its own performance almost every time. The number most teams reach for first is the average B2B win rate of 21% across all opportunities, which climbs to 29% once you restrict the pool to qualified pipeline only, according to Landbase's benchmark data. That eight-point spread between the two figures should be the first warning sign: the gap already signals how much the denominator choice distorts the number, before deal size even enters the picture.
The deeper issue is what's baked into that 21% Landbase. It's a blend, an average of SMB teams winning north of 30% mixed in with enterprise teams stuck in the mid-teens, plus everything in between Landbase. Apply that blended figure uniformly across an org with different segments and someone is going to walk away with the wrong story. A mid-market team at 24% might read that against an inflated benchmark and feel mediocre, when 24% is in fact healthy for their segment Landbase. Meanwhile an enterprise team converting 15% might panic, measuring themselves against the same inflated blended average, when 15% is in fact healthy for deals of that size and complexity Landbase.
This piece exists to fix that mismatch. What follows is a tier-by-tier translation, covering reply rates, win rates, sales cycle length, pipeline mix, and CAC payback, all broken out by deal size so a team can finally compare itself to the baseline that actually applies to its segment.
How deal size maps to the four tiers this piece uses
Four tiers recur across the benchmark sources, and each is anchored to average contract value (ACV) rather than to headcount or revenue, because ACV is what actually determines the shape of a sales motion.
These aren't just size labels slapped onto a spreadsheet. Each tier represents a structurally different sales motion: the number of people who can kill a deal, the length of procurement, whether legal and security review even enter the picture, and whether outbound math pencils out at all shift together as ACV rises. What Optifai's study of 847 companies establishes isn't scattered or anecdotal: win rates follow a consistent, predictable slope as deal size increases, tier by tier. That's the scaffolding the rest of this piece hangs on. No single number in this section is meant to be the headline; the job here is just to give the vocabulary that makes every subsequent figure legible.
Win rate benchmarks across the four tiers and what counts as healthy at each tier
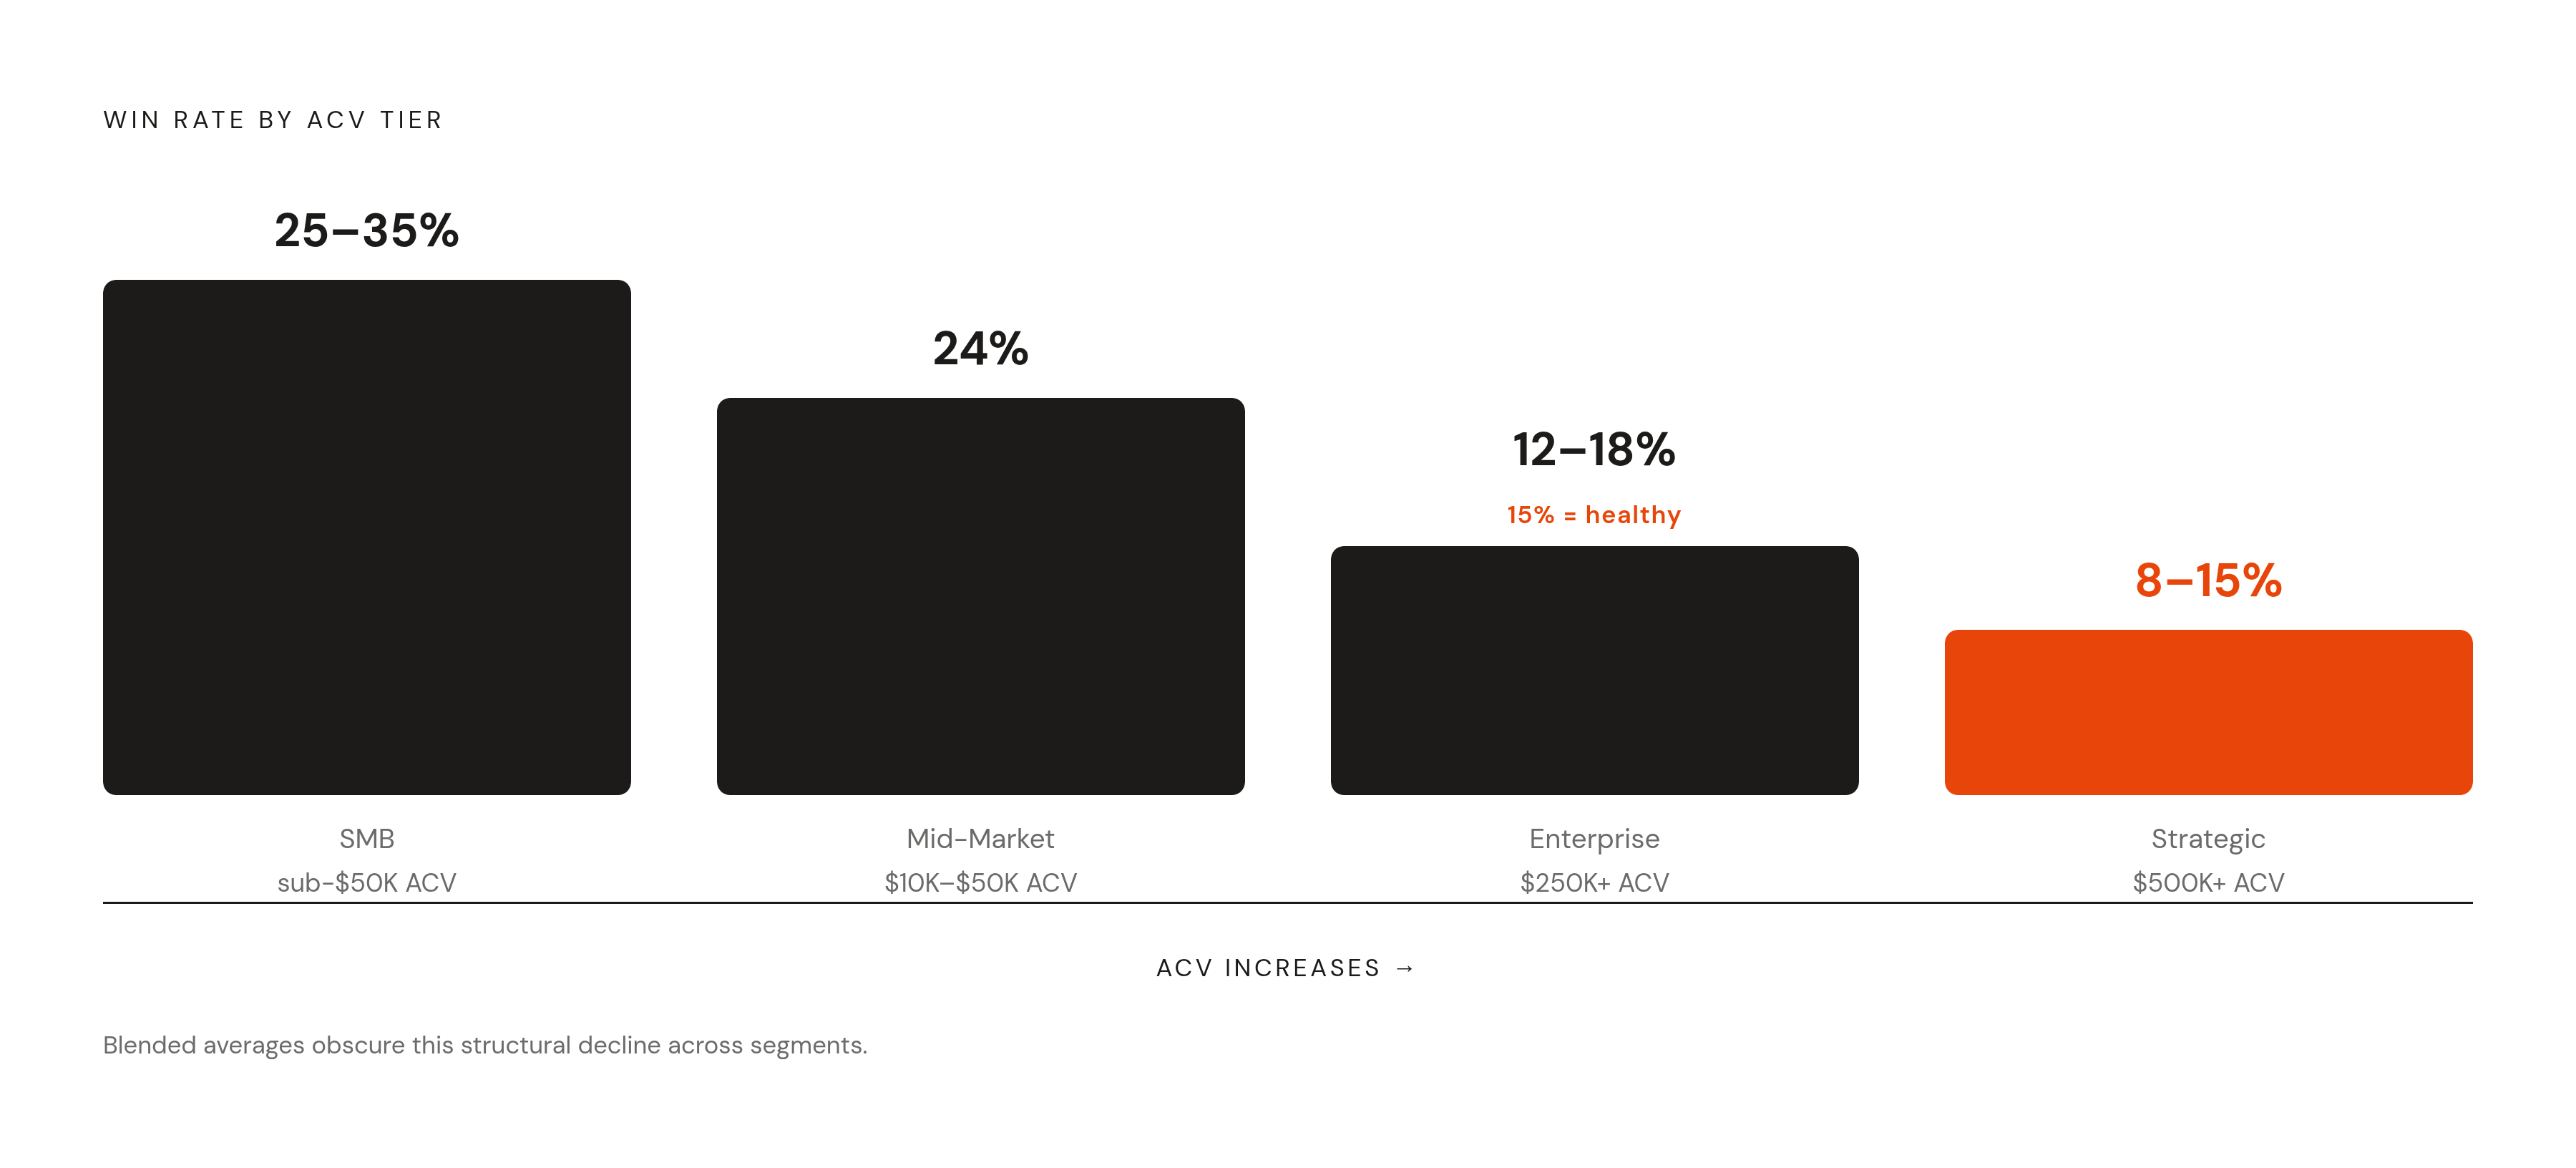
Start with the Optifai numbers, since they lay out the clearest tier-by-tier win rate range available. Deals under $50K ACV win at 25 to 35%. Cross $250K and it drops again to 12 to 22%. Past $1M, win rates settle into 10 to 18%. The pattern is a steady decline as deal size climbs. It's a steady decline as deal size climbs, and that decline is the single most important structural fact in this entire piece.
Zoom into mid-market specifically, the $10K to $50K band, and 20 to 28% is the normal range, with a median of 24%. That's arguably the most useful single reference point in the whole benchmark landscape, since mid-market represents the largest share of B2B SaaS teams by volume. Above $100K, enterprise win rates run 12 to 18%, and 15% is specifically called out as healthy and sustainable, not a warning sign. That framing matters because plenty of enterprise teams treat a 15% win rate as evidence something's broken, when it's actually right where the tier says it should sit Landbase. Push into strategic or mega-deal territory, above $500K, and win rates fall further, to 8 to 15%, with cycles stretching 6 to 18 months. The low win rate there isn't dysfunction. It's a structural feature of selling at that altitude, where more stakeholders, more competitors, and more procurement friction are simply part of the terrain.
Deal size isn't the only variable, either. Sales motion stacks its own band on top of the deal-size band. Warm or relationship-led motions win at 30 to 40%, while cold outbound into enterprise accounts runs 8 to 15%. Selling to people who already know the product, former customers, or champions who've moved to new companies, wins at 37%, against 19% for cold outreach to strangers, per Champify's Impact Report. That's nearly double, a gap teams should weigh every time they debate whether relationship-building deserves its own line item in the pipeline plan.
The market itself is moving. The Ebsta x Pavilion report found overall B2B win rates falling to 19%, down from 29% the year before, a genuinely steep year-over-year compression. So even the "normal" ranges by tier are operating under headwinds right now, and a team needs to figure out whether it's underperforming its tier or simply riding the same downward current as everyone else. Put it together and the practical rule is this: set a win rate target against your ACV tier, your dominant sales motion, and the current direction of the market, never against one published average pulled from a blog post⟧c27⟧.
Cold email reply rates by deal size tier and why the gap between average and elite comes down to relevance
The market-wide baseline for cold email, per Instantly's Cold Email Benchmark Report drawn from a large volume of sent emails, puts the average reply rate at 3.43%, with the top quartile at 5.5% and elite senders clearing 10.7%. That's already a meaningful spread on its own, before deal size gets layered in.
Layer it in and the picture sharpens. Cleverly's analysis, via Autobound, breaks reply rate down by tier. SMB SaaS, sub-$50K ACV, sees 10 to 18% reply rates, though that volume comes with a catch: meeting quality tends to be lower and churn risk higher. Enterprise, $250K-plus, drops to 5 to 10%, but each conversation at that altitude carries outsized pipeline value even though fewer people reply.
Why exactly does this happen, the gap between a 3% average and a 10%-plus elite tier? It comes down almost entirely to relevance, not clever copywriting. Sequencing data backs this up too. Instantly found that 58% of all replies come from the first email in a sequence, with follow-ups contributing the remaining share, and step-2 emails styled as casual replies generate a meaningful lift.
That raises an important question for anyone staring at a reply rate dashboard: which number actually matters more, the rate or the list it's measured against? At enterprise deal sizes, a tight 5% reply rate on a carefully qualified list can produce more usable pipeline than a 15% rate fired at a sloppy SMB list. The denominator carries as much weight as the numerator. One more caveat on open rates: the commonly cited 15 to 25% benchmark comes from marketing email, not cold outbound, and Apple's Mail Privacy Protection inflates open tracking across the board anyway. Reply rate remains the more trustworthy signal, at every tier. In the section on cold email reply rates by deal size tier, and why the gap between average and elite is almost entirely about relevance, the mid-market ($50K–$250K ACV) tier is described as the sweet spot, with reply rates of 8–12% and stronger meeting-to-close ratios.
Sales cycle length and CAC payback as a function of deal size
Sales cycles stretch out in lockstep with deal size, according to Norwest's Sales & Marketing Benchmark, cited via Gradient Works. SMB deals, roughly under $25K ACV, close in about 90 days.
Cycles overall have been getting longer since the early 2020s, and the reasons are structural rather than incidental. None of that is going away.
But how does this affect the original win rate conversation? Directly, and painfully. The Ebsta x Pavilion report found that delayed deals see win rates drop by 113%, while getting decision-makers involved early boosts win rates by 55%. So cycle length isn't just a scheduling problem sitting off to the side of the win rate conversation. It's a lever that moves win rate itself, in either direction, depending on whether a rep lets a deal drift or keeps the right people engaged from the start.
CAC payback follows the same upward slope as deal size grows. The median across B2B SaaS is around 15 months overall, but that median hides a steep range: roughly 9 months below $5K ACV, stretching to roughly 24 months above $100K, according to Benchmarkit's data via Empralabs. That has a direct cash consequence for anyone building a plan around enterprise deals. A founder or early-stage GTM team pursuing enterprise deals needs to model the cash impact of an extended payback period alongside pipeline coverage math, because a 15% enterprise win rate at 6 to 9 month cycles requires a very different pipeline multiple than a 30% SMB win rate at 30-day cycles. Get that multiple wrong and the quota math falls apart before the quarter even starts, which might explain part of why only about 27 to 30% of B2B reps hit quota in 2024, down from a historical norm closer to 40 to 50%, per Autobound and Miniloop. Benchmarking against the correct tier stops being an academic exercise at that point. It's the difference between diagnosing a rep problem, a process problem, or a structural problem baked into the deal size itself.
Pipeline mix benchmarks by ACV tier and ARR stage and how outbound's share of the mix grows with deal size
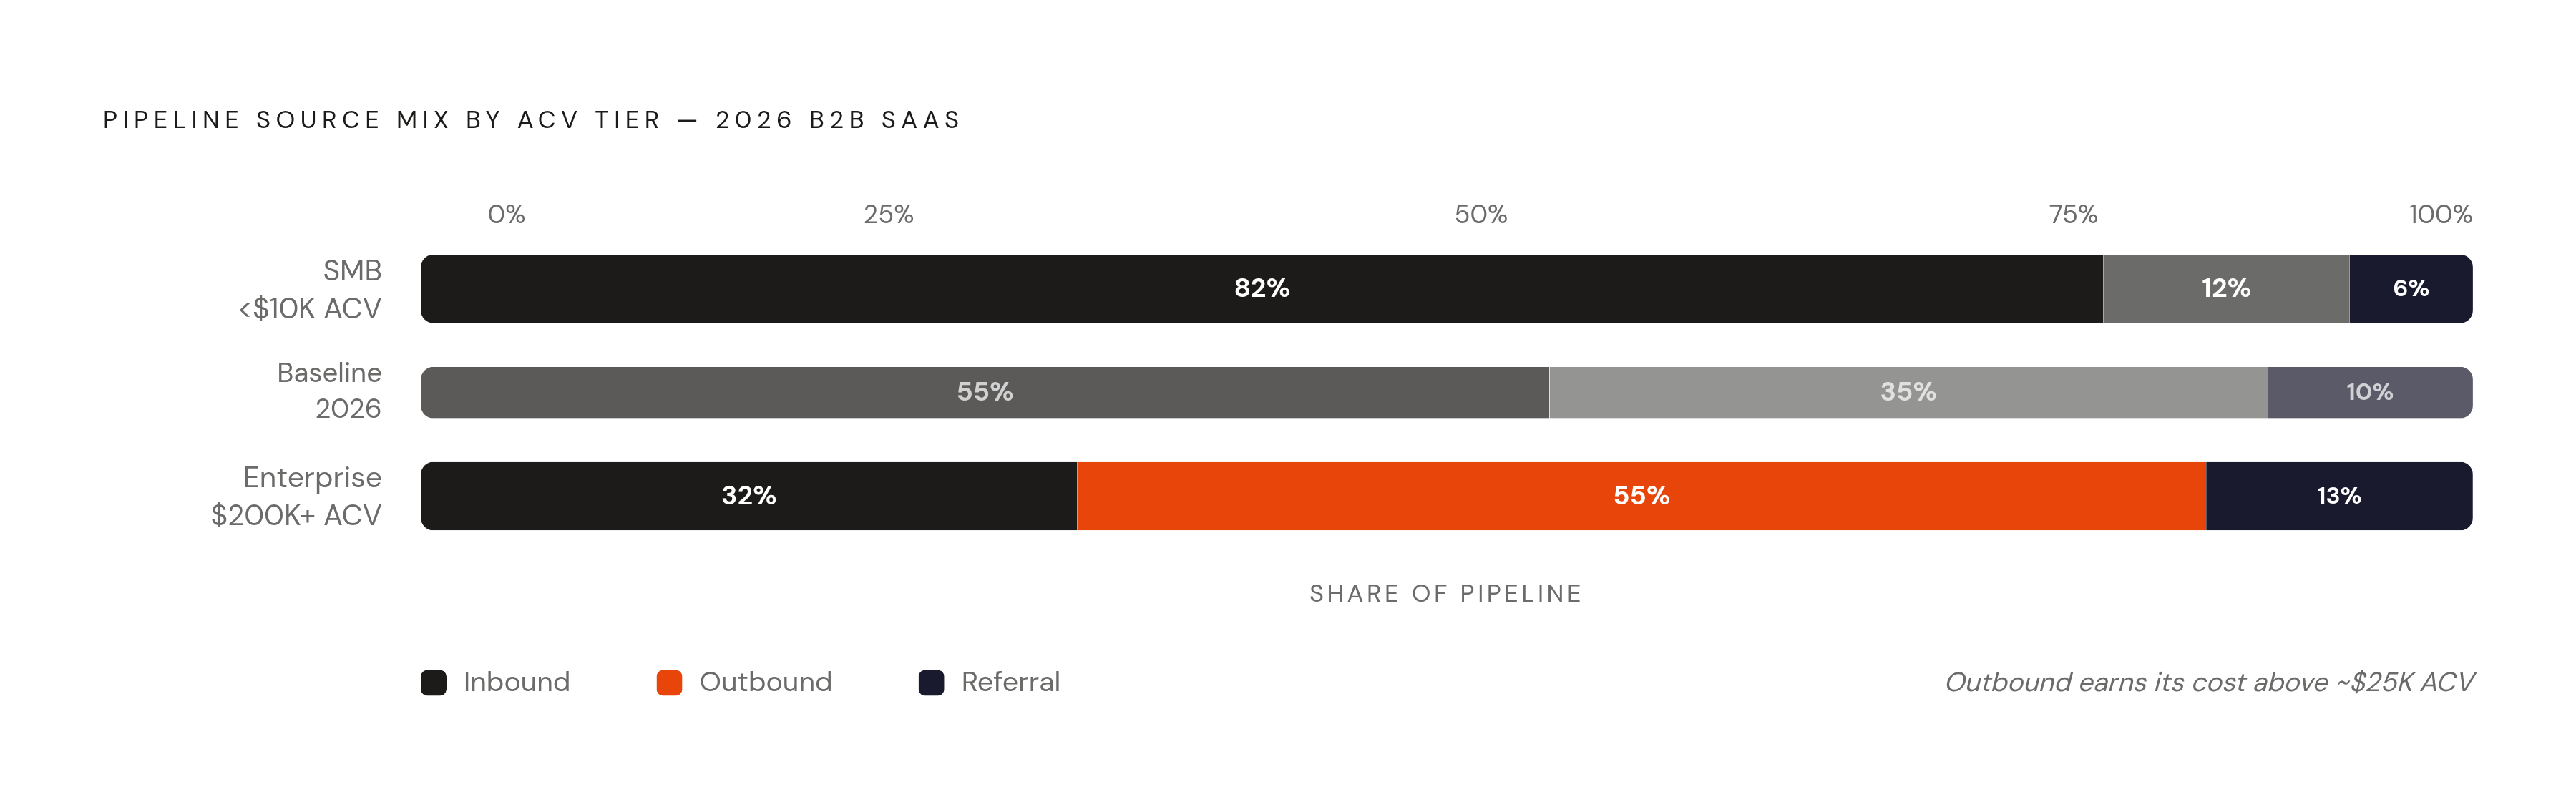
The overall 2026 pipeline mix for B2B SaaS is 55% inbound, 35% outbound, 10% referral, per GrowthSpree. As with win rate, that median flattens out a wide range hiding underneath it. Broken out by ACV tier, the picture looks quite different. SMB, sub-$10K ACV, runs over 80% inbound, and for good reason: outbound simply isn't economical at that price point, since the cost per lead outpaces what the contract can sustain. Enterprise, $200K-plus, flips the ratio: 32% inbound, 55% outbound, 13% referral, outbound dominant, since inbound volume is constrained at high ACV because few enterprise buyers search for niche SaaS.
ARR stage tells a parallel story.
One might ask why outbound's share keeps climbing on both axes at once. The conversion economics explain it. So the tradeoff is what each channel is built to buy." It's what each channel is built to buy. For an early-stage founder running outbound at sub-$10K ACV, the economics point away from cold outreach and toward inbound or product-led growth instead; cross $25K and outbound starts generating a return that justifies the spend; past $100K, outbound should be carrying the majority of pipeline. Inbound buys efficiency. Outbound buys selectivity and higher ACV. Different tools, different jobs.
What signal-based outreach does to these benchmarks across tiers
Personalization moves reply rate on something closer to a step function than a gradual slope. Generic cold outreach is in the 1 to 5% range, roughly matching that 3.43% market average. Basic personalization, first name, company, job title, nudges that up to 5 to 9%. Signal-based personalization, tying the message to an actual trigger event and pairing it with a relevant value proposition, jumps to 15 to 25%, according to Autobound's data. That's a different category of outcome, not an incremental bump. It's a different category of outcome.
What counts as a trigger worth layering onto a static ICP? Funding rounds, leadership changes, M&A activity, product launches, hiring surges, competitor mentions, the kind of events that make an email feel timely instead of presumptuous. Teams that act on an intent signal within 24 hours see a 29% lift in opportunity creation compared to teams that wait, according to SalesMotion's data. Gartner's 2025 Sales Survey adds a sobering data point: 61% of B2B buyers now say they'd prefer a rep-free buying experience altogether. The window for relevant outreach isn't just narrow, it's actively shrinking, and generic email that lands outside an actual buying moment increasingly gets ignored rather than politely redirected.
How does this play out differently across the four tiers? At SMB, signal timing matters less, since cycles are short and the buying decision gets made quickly regardless of what triggered the first email; volume and basic targeting quality carry more weight than any single signal Landbase. At mid-market, signal-based outreach becomes the sharpest differentiator available, competitive enough that generic email gets buried in the inbox, but fast-moving enough that a well-timed trigger can meaningfully compress the cycle. At enterprise, signals stop being optional and become table stakes for even getting a foot in the door: without a legitimate reason to reach out, cold email tops out at that 5 to 10% ceiling, but with the right trigger, the gap closes toward 15 to 25%. The strongest signal of all doesn't come from monitoring the news. It comes from relationships: selling to known contacts, past customers or champions who've since changed jobs, delivers a 37% win rate against 19% for cold strangers, per Champify's report. That functions as its own signal category entirely, especially at enterprise ACV, where relationships still function as the primary currency of the deal.
A practical tier-by-tier benchmark reference
Put all of it side by side and the tiers start to tell a coherent story rather than a scattered pile of statistics. SMB, sub-$50K ACV: win rates of 25 to 35% under $50K, reply rates of 10 to 18%, cycles around 90 days below roughly $25K ACV, CAC payback approximately 9 months below $5K ACV, pipeline mix over 80% inbound for sub-$10K ACV.
None of these ranges are a scorecard to hit perfectly. They're a compass, a way to tell whether a number that looks alarming on its own is actually right where it should sit for the size of deal being sold. A 15% enterprise win rate isn't a fire to put out Landbase. Win rates have been sliding market-wide and cycles have been stretching for structural reasons that show no sign of reversing. Read against the right tier, though, these numbers stop being a source of anxiety and start doing what a benchmark is actually supposed to do: telling a team, with some precision, where it stands.
Sources
- Win Rate Benchmarks by Industry, Deal Size, and Source in 2026 | Landbase
- 10 Outbound Sales Benchmarks from 100+ SaaS Teams | Autobound
- Sales Win Rate: How to Calculate and Benchmark in 2026 | Salesmotion
- 2025 B2B sales performance benchmarks
- B2B SaaS Inbound vs Outbound Pipeline Mix Benchmarks 2026: Optimal Mix by ARR Stage, ACV Tier, Vertical, and Conversion Rate Comparison
- B2B SaaS Win Rate by Deal Size — The Win Rate Paradox (939 Companies) | Optifai
- B2B SaaS Outbound CAC Benchmarks (2026): What Good Looks Like
- 2025 SaaS Performance Metrics | Benchmarkit