On-Target Earnings for B2B Sales Roles in 2025 and 2026
Base salary and variable pay split reveal the real income floor, not just the ceiling.

On-target earnings for B2B sales roles sit somewhere between a promise and a projection, and 2026's benchmarks make that gap harder to ignore than ever. A sales rep's OTE tells you base salary plus what gets paid out if quota lands at exactly 100%, but the number printed in an offer letter and the number that lands in a bank account are, for most reps, not close to the same figure. Understanding the mechanics behind these benchmarks, not just the headline dollar figures, is what separates a hiring manager who builds a comp plan that retains talent from one who watches attrition climb every January.
How the base-to-variable split varies by role and what that signals about each job's risk profile
Pay mix isn't decoration on top of a comp plan. It's a direct readout of how measurable and how attributable a role's output actually is, and it tells a candidate exactly how much income risk they're accepting the moment they sign.
SDRs and BDRs typically see a 70/30 to 80/20 split favoring base. Booking a meeting depends partly on things the rep can't control (list quality, timing, whether a prospect answers the phone that week), so companies protect entry-level income with a heavier fixed component. Account Executives carry more risk: a 50/50 or 60/40 split is standard, and RepVue's 2026 guide puts base at 50% to 53% of OTE across closing roles, which tracks with the idea that reps who own the close should have real skin in the outcome. Sales Engineers run the other direction, closer to 70/30 base-heavy, because the role supports a team outcome rather than owning an individual number. Customer Success Managers with renewal ownership are often at 75/25 or as high as 80/20, reflecting a retention quota rather than net-new pipeline generation. Sales managers carry variable tied to the team's rolled-up quota instead of any one deal, with a split that shifts toward base relative to frontline AE roles. Senior leaders, VPs and CROs, carry a meaningful variable component, with equity picking up additional slack that cash variable would otherwise carry at earlier stages.
Here's what this means for someone comparing two job offers with the same OTE headline: the split determines the income floor, not just the ceiling. A 70/30 split pays 70% of stated OTE even at zero attainment. A 50/50 split pays half. Two offers that look identical on the top line can differ by tens of thousands of dollars in a bad quarter, and that difference becomes visible only if someone asks about the split directly.
Boards increasingly want more leverage tied to performance, and there is broader industry discussion about whether AE pay mix should shift further toward variable in mid-market and enterprise roles. Does that leverage actually produce better performance, or does it just shift risk onto the rep while the rep has no more control over pipeline than before?
SDR and BDR OTE benchmarks for 2026
Fullcast's 2026 benchmarks put median SDR/BDR base salary at $60,000 and median OTE at $85,000. Top performers stretch well past that: Fullcast cites figures up to $127,955, and Apollo's 2026 guide has top BDRs clearing $130,000. Outreach.ai's 2026 data shows a wider band, $75,000 to $100,000 OTE on a 70/30 mix, and that spread mostly comes down to company stage and segment. A go-to-market motion built around smaller-business customers and one built around large enterprise accounts are, functionally, different jobs wearing the same title.
Segment naturally drives meaningful variation within that overall band, with enterprise-focused SDRs and BDRs sitting toward the top of the range and those covering smaller accounts toward the bottom.
SDR quota is activity-based, meetings booked or opportunities qualified, not a revenue multiple. So the quota-to-OTE ratios that govern AE comp (more on that below) simply don't map onto this role. The spread between median and top-performer OTE at the SDR level is unusually wide given how modest the base is, which says outperformance at this tier isn't incremental. It's dramatic. A rep who consistently beats quota here isn't earning just a modest bit more than the median. They're earning substantially more, well above the median.
Anyone negotiating an SDR or BDR offer should ask a pointed question before signing: what counts as a "qualified meeting"? Quota attainment at this level is only as honest as the ICP definition sitting behind it. A loose definition inflates attainment numbers and hides the fact that the pipeline downstream is full of junk.
Account Executive OTE benchmarks across SMB, mid-market, and enterprise in 2026
CaptivateIQ's data puts average OTE across all sales roles at $174,000, with a median of $150,000, useful mostly as a baseline before segment cuts start to matter. Narrow to SaaS AEs specifically and RepVue's current 2026 data shows a general median of $200,000; Optymyze's 2026 benchmark page cites the same source rather than independent research, which is easy to mistake for corroboration.
The segment breakdown tells the real story. SMB AEs generally run at the lower end of the AE OTE range, on a 50/50 split, with quota multiples toward the lower end of the 4x-to-6x band the market has converged on. Mid-market AEs are $170,000 to $230,000, also 50/50, quota multiple 5x to 6x, a range corroborated separately by RepVue and Optymyze at $160,000 to $220,000. Enterprise AEs top out highest: $240,000 to $340,000 per salescookie.com, though RepVue and Optymyze put the range at $230,000 to $270,000-plus, and The Quota's 2025 Sales Salary Guide shows an enterprise AE median OTE of $255,000. The gap between these sources isn't a contradiction so much as a reminder that "enterprise AE" covers a wide range of deal sizes and sales cycles depending on the company.
Top performers blow past all of these numbers. Fullcast's 2026 data shows a ceiling up to $483,796, which explains why uncapped commission structures matter so much for retaining enterprise AEs. Cap the upside and the best rep on the team starts taking recruiter calls.
The State of B2B Sales Compensation 2026 report shows mid-market AE comp moved up roughly 6% to 9% from 2024 to 2026, outpacing general wage inflation over the same stretch. Bridge Group's AE Metrics & Compensation Benchmark Report pins the associated quota benchmark at roughly $800,000 on a 4.2x OTE multiple, consistent with the broader market range.
Companies that push quota-to-OTE past 7x or 8x tend to see attainment collapse below 60% and turnover climb above 25%. Companies that push quota-to-OTE past 7x or 8x tend to see attainment collapse below 60% and turnover climb above 25%. Push the ratio below 4x and the math starts breaking the other direction: comp expense becomes a line item CFOs can't ignore. The 4x-to-6x band the market has converged on isn't arbitrary caution. It's the range where quota stays achievable enough to retain talent without comp eating the margin.
Geography adds a layer most national benchmark tables ignore, with major metro markets typically commanding a premium over the national median and fully remote roles often landing below it. Companies vary widely in whether they apply geographic zones or use a single flat national OTE number. Which approach is fairer probably depends on whether cost of living or market rate for talent is the thing a company thinks it's actually paying for.
OTE for Sales Engineers, Customer Success Managers, and adjacent technical roles
Sales Engineers are at a median OTE near $205,000 per RepVue's data, on a pay mix around 70/30. Quota here is team-based or pooled rather than tied to individual closes, which makes sense: the SE's job is to make the technical case land during a deal cycle, not to own the deal outright. By segment, segment naturally drives meaningful variation within that overall range, with enterprise-focused SEs sitting toward the top and smaller-business-focused SEs toward the bottom.
Customer Success Managers with renewal ownership sit lower, median OTE around $140,000 per RepVue, with pay mix at 80/20 or heavier toward base. Quota is tied to gross or net revenue retention, not net-new pipeline, which is a fundamentally different kind of number to chase. Segment drives meaningful variation within that overall band, with enterprise CSMs sitting considerably higher than those covering smaller accounts.
A structural shift now has more CSMs carrying a variable component tied directly to gross revenue retention, replacing the softer bonus structures based on individual objectives that used to be standard. That change nudges CSM comp toward looking like a lighter, retention-flavored version of AE comp rather than a flat bonus tacked onto a support role.
Here's the point hiring managers tend to miss: the heavier base weighting in these roles isn't a sign the company undervalues them. It's calibration. An SE or a CSM influences the outcome, sure, but doesn't solely determine it the way an AE closing a deal does. Push a higher variable percentage onto a role with limited control over the underlying metric and the likely result isn't better performance. It's a retention problem, because the rep is now carrying income risk for outcomes they can't fully move.
First-line sales manager, VP of Sales, and CRO compensation structures
First-line sales managers, the player-coaches running a team of AEs while sometimes still carrying deals themselves, are $200,000 to $280,000 OTE per RepVue and Optymyze's data, with variable tied to the team's rolled-up quota rather than personal closes, on a 60/40 split. The State of B2B Sales Compensation 2026 report segments that as $180,000 to $230,000 at SMB, $240,000 to $310,000 at mid-market, and $300,000 to $400,000 at enterprise.
Regional VPs of Sales run from $280,000 to $360,000 at SMB-segment companies up to $420,000 to $560,000 at enterprise, on the same 60/40 logic tied to the whole org's quota. Pavilion's 2025 GTM Compensation Benchmarks, drawn from a survey of 1,200 go-to-market leaders, puts VP of Sales OTE at growth-stage companies between $350,000 and $450,000, with the broader range across stages running $250,000 to $450,000-plus depending heavily on how much equity is layered in at earlier stages.
CROs top the ladder: $600,000 to $800,000 OTE plus equity per Pavilion's data, with the State of B2B Sales Compensation report showing a range from $400,000 to $550,000 at SMB-segment companies up to $700,000 and well beyond at enterprise. Talentfoot's 2026 executive search sample shows a median near $275,000 across senior leaders broadly, though that figure reflects Talentfoot's own candidate pool of companies actively searching, not the market as a whole, so it reads lower than the other benchmarks for that reason.
Good comp design at this level shifts the split by stage: 50/50 at startup, 60/40 at scale, 70/30 or higher once the company reaches enterprise maturity. And the variable itself shouldn't hang off a single number. Net new ARR matters, but so does team quota attainment, CAC payback, gross margin on new deals, net revenue retention, ramp time for new hires, and pipeline velocity. A CRO paid purely on bookings has every incentive to discount margin away to hit a number, which solves this quarter's problem while creating next year's.
Equity deserves its own line here. At venture-backed companies, equity substitutes for a meaningful chunk of cash variable at the VP and CRO level, especially early on. Benchmark cash OTE alone at a company that has just raised an early venture funding round against cash OTE at a public SaaS company and the comparison understates what the earlier-stage package is actually worth, assuming the equity has any chance of being worth something.
The quota attainment problem that makes stated OTE misleading in practice
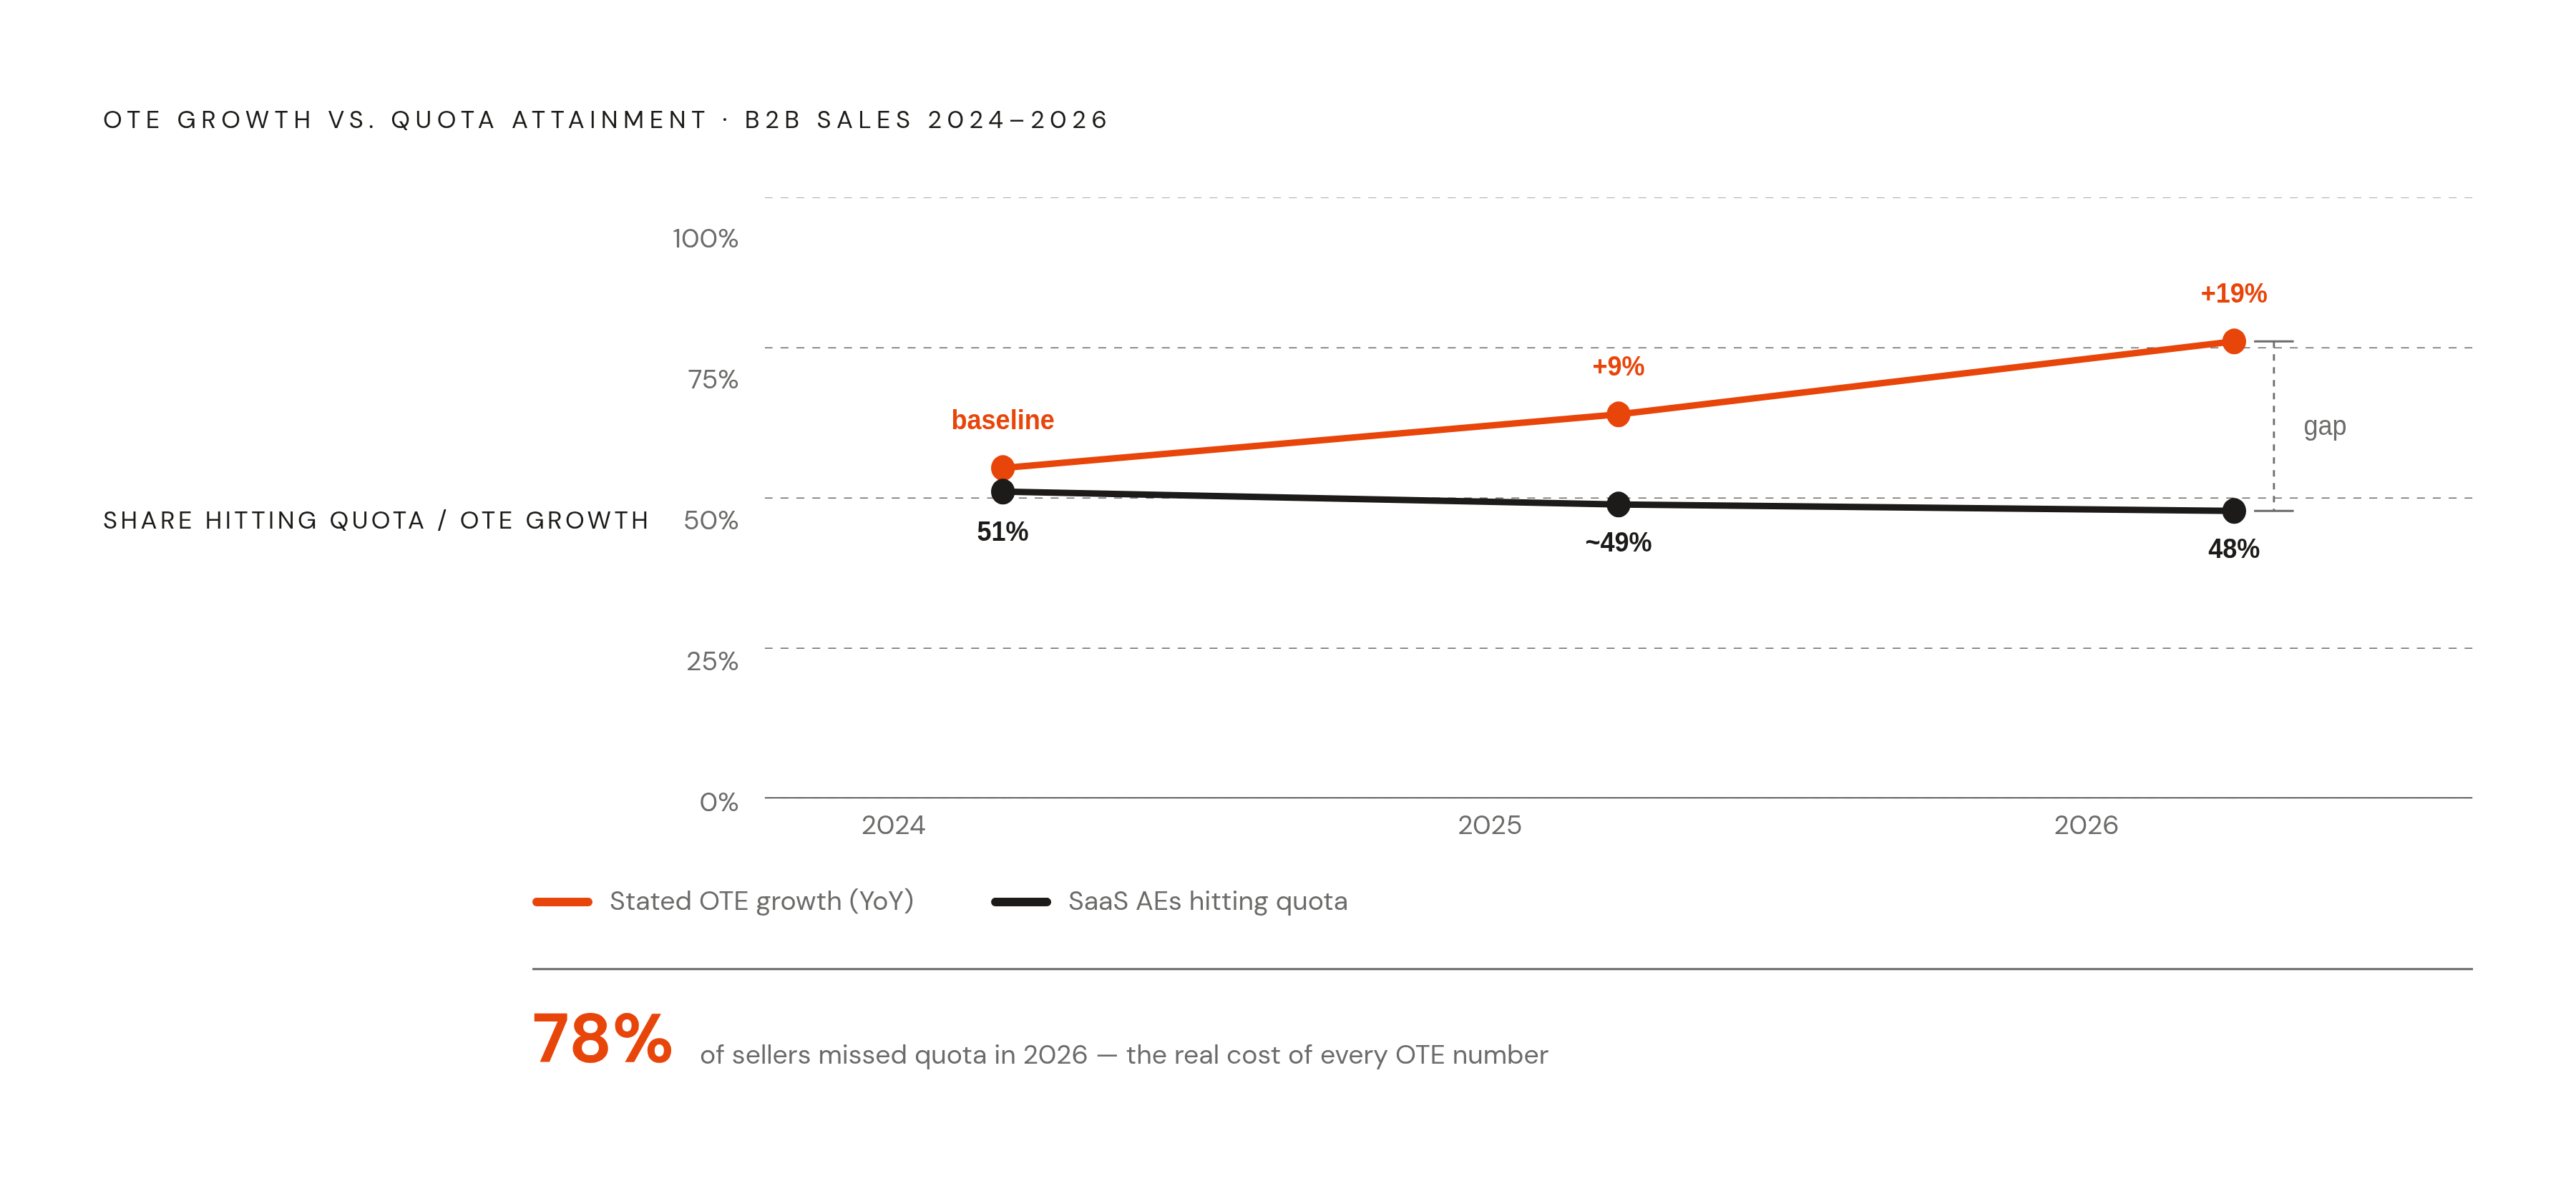
Fullcast's Benchmarks Report found that more than 78% of sellers missed quota in 2026, and that number should reframe everything above it. And yet OTE structures across the industry kept climbing 9% to 19% year over year over the same stretch. Sit with that for a second. Stated pay went up while the share of people actually earning it went down. What does that tell you about what OTE is actually measuring?
Data from RepVue, Gong, and Forrester shows average quota attainment across B2B sales runs 43% to 47%, with SaaS and cloud specifically clustering around 42% to 46%. Bridge Group's AE Metrics & Compensation Benchmark Report shows only 48% of SaaS AEs hit annual quota in 2026, down from 51% two years prior. That's not a rounding error. That's a trend line moving the wrong direction while headline comp keeps rising.
The State of B2B Sales Compensation 2026 report shows a healthy attainment distribution looks roughly like this: about 60% of reps are in the 50% to 100% attainment band, 15% clear 100%, and 25% fall below 50%. Two warning signs bookend that healthy range. If more than half the team sits below 50% attainment, quotas are set too high, or pipeline investment isn't keeping up with the number reps are asked to hit. If 30% or more of reps are clearing 120%, the opposite problem: quotas are set too low, and the company is probably overpaying for output it could get more cheaply.
Attainment climbs with seniority, which makes intuitive sense. RepVue's 2026 guide shows individual contributors clustering between roughly 40% and 58%, with sales managers and VPs sitting progressively higher up the chain, likely because they have more control over pipeline allocation, deal support, and where their own effort goes.
Run the actual math on a stated OTE and the picture gets uncomfortable fast. A rep with a stated OTE of $195,000 attaining 43% of quota isn't earning anywhere close to that figure. They're earning base plus a partial variable payout, which for many reps lands closer to the base salary alone than to the number printed in the offer letter. The median AE, in other words, is probably not earning anything close to "median OTE." They're earning base plus a fraction of variable, and that fraction is the actual number that determines whether they can pay rent.
Fullcast frames the underlying issue precisely: the compensation model itself isn't necessarily broken. What's broken is the disconnect between how OTE gets structured on paper and how quotas actually get deployed, tracked, and managed in practice. A comp plan is only as good as the quota-setting process that produces it, and quota-setting is where most of the dysfunction actually lives.
For anyone negotiating an offer, there's one question that cuts through all of this faster than any benchmark table: what percentage of reps hit 100% of quota last year? If the answer is under 50%, the OTE listed on the offer is aspirational math, not a realistic income projection. And for anyone designing comp plans, a rising OTE benchmark year over year isn't proof the market is paying more. It might just be proof that the gap between what's promised and what's delivered is getting wider, and that gap is a retention risk hiding inside a number that looks, on the surface, like good news.
How company stage shapes OTE budgets and what founders should expect to spend
Sales comp as a share of revenue doesn't hold steady as a company grows. It compresses, often sharply, as the business scales and the unit economics of paying for growth start to shift under a founder's feet. At the pre-product-market-fit stage, the State of B2B Sales Compensation 2026 report shows sales comp running around 25% of revenue, a figure that reflects just how expensive it is to build a sales motion before there's a repeatable product to sell. Every dollar of comp at that stage is largely a bet on discovering what actually works, not a payment against predictable output.
That's the reality founders need to plan around: early-stage comp isn't inefficient, it's front-loaded risk. The percentage comes down as revenue scales and the sales motion becomes more repeatable, but the early number is the one that catches founders off guard when they benchmark against a mature company's comp-to-revenue ratio and wonder why their own math looks so much worse. It doesn't look worse. It's earlier.
Sources
- What Is OTE Salary? Complete 2026 Compensation Guide | Apollo
- The State of B2B Sales Compensation 2026: Benchmarks and What Is Changing
- On Target Earnings (OTE): Sales Comp & Quota Alignment Guide - Fullcast
- Sales Compensation Statistics 2026: Trends & Insights
- Sales Compensation Benchmarks 2026: OTE, Pay Mix & Commission by Role
- On-target earnings: How to budget OTE you can defend | Outreach
- repvue.com
- qobra.co